Executive Summary
- New fair value range adjusted downward by $7 per share on average – in the same direction as our investment.
- Error relates to the amount of the fuel surcharge the company charges its clients.
- Some of the internal price and volume statistics change, but we do not believe that our fundamental thesis or methodology is materially incorrect.
Details
Over the past few days, I have been working on pulling together the Guided Tear Sheet for our latest high-conviction valuation which resulted in a bearish recommendation in Union Pacific (UNP).
While it is a lot of work to pull these presentations together, it gives me the chance to review my valuation work and take a look at my source materials again.
Today, I was happy to have had the chance to review my Union Pacific model, as I found a copy-paste error on my part related to fuel surcharges. Correcting the error results in the extreme best-case valuation scenario dropping by $8 per share to $99 per share and the extreme worst-case valuation scenario dropping by $5 per share to $60 per share. Overall, the error represents about 10% of the average of those two values and is in the direction of our investment.
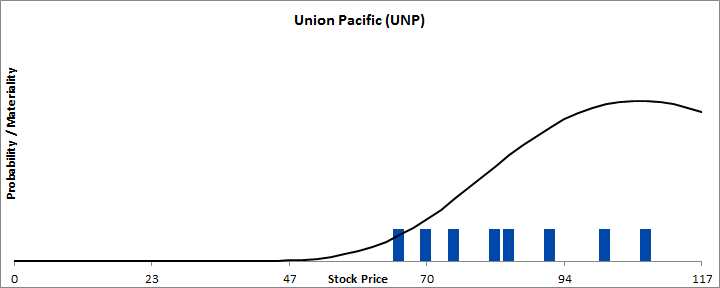
Figure 1. Previously estimated valuation range. Source: Company Statements, Framework Investing analysis
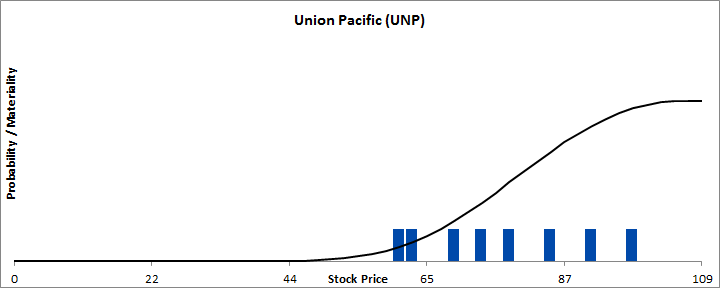
Figure 2. Corrected estimated valuation range. Source: Company Statements, Framework Investing analysis
The company records its expense for fuel in the financial statements, and provides a footnote about the amount clients paid in surcharges; the surcharges partially offset Union Pacific’s fuel costs.
In an early version of my workbook, I stored the fuel costs on one row and the fuel subsidies on the one below. When I pulled data together into the model, I copied the wrong row – the row that had recorded the total fuel expense rather than the amount of the surcharge. Because the expense was larger than the surcharge, and because I forecast future revenues based on the inflated figure, my forecasts of revenue growth were too high.
The model below incorporates the corrected figures.
 Loading...