This overview accompanies the IOI Valuation of salesforce.com (CRM) and is split into the following sections:
- Revenue Scenarios
- Economic Profit Scenarios
- Investment Efficacy Scenarios
- Balance Sheet Effects
IOI?s explicit forecast period for salesforce.com lasts five years. Since salesforce.com is a young company that is still in its high-growth phase, we use a 10-year implicit growth stage rather than our usual 5-year one. Please see the Investment Efficacy Scenarios section for more information.
Revenue Scenarios
The entire time I was working on this valuation, I thought it was as much an exercise in anchoring bias as it was one of corporate valuation.
Any company in its initial rapid-growth phase is extremely difficult to value. One must make assumptions regarding all three drivers of valuation–revenue growth, the ability to convert revenue to profits, and investment efficacy–and there is such a short track record, it is difficult to do anything other than guess at the value of these drivers.
For revenue growth, we went back to look at Oracle‘s ORCL early growth rate and based our best- and worst-case assumptions on our analysis of that company. Starting two years before each companies’ IPOs normalized revenue growth at the two companies look like this:
 |
| Normalized Revenue Growth For Oracle and salesforce.com pre- and post-IPO Source: Company statements, IOI Analysis |
There are various reasons why these two growth rates are not directly comparable. One accounting reason deals with an issue called “Revenue Recognition.” CRM does not sell licenses to its customers (as does ORCL), but rather sells subscriptions to them. Subscription businesses (e.g., newspapers) typically receive the money for all or most of the subscription length up front, but must supply a good or service for an extended time after receiving the client money.
In this situation, the client monies received cannot be counted as revenues until the company’s obligations to the client are completely fulfilled, so go into an accounting purgatory for a certain time. Each quarter, when the subscription company announces earnings, it can take another 90 days worth of unrecognized revenues out of accounting purgatory and list them as top-line revenues.
If CRM, for instance sells an annual subscription to its software on January 1 and receives $100, and another $100 annual subscription to its software on March 30, it’s revenue for the first quarter will be just $25 (one quarter of the $100 sale on January 1; nothing, or very little, from the quarter-end subscription).
Over time, as a subscription software seller and a licensed software seller grow and the respective businesses mature, these differences will even out. However, during the high-growth phase, the subscription seller’s revenues are going to look weaker and the profitability lower.
Keep this revenue recognition issue in mind when we discuss economic profitability below.
While not directly comparable, the above graph suggested that CRM was roughly on the same growth trajectory as ORCL, so we anchored on historical growth rates for ORCL to think about what might be reasonable for CRM.
Rolling 10-year and 5-year compound annual growth rates (CAGRs) for Oracle over its history look like this:
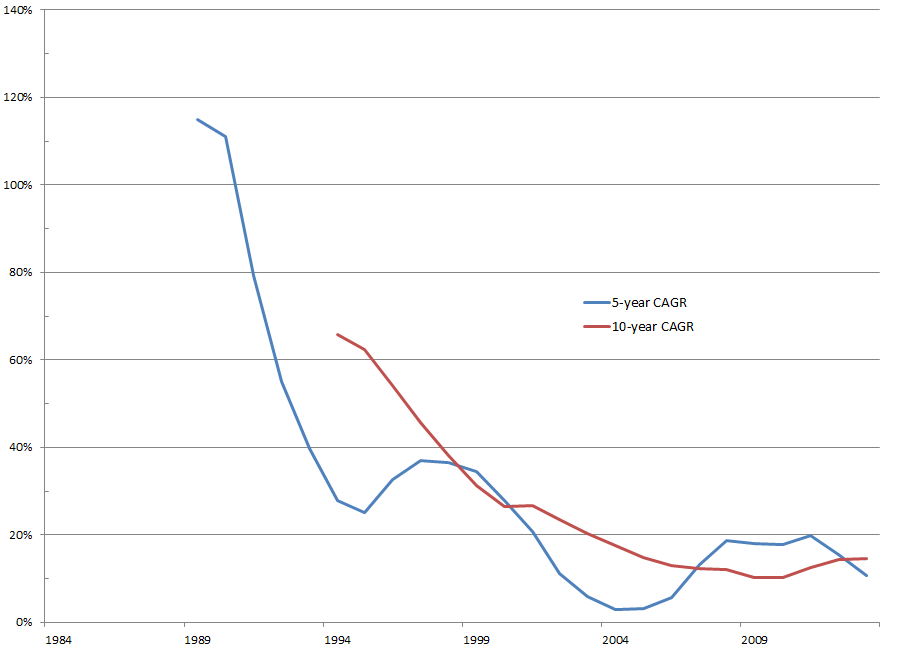 |
| 5- and 10-year Revenue CAGRs for ORCL Source: Company statements, IOI analysis |
Within this series is the Tech Bust, but even including two year-over-year revenue declines (-11% in ’02 and -2% in ’03) and one flat year (’13), Oracle has still had an average growth rate of 32% over its history.
Eyeballing these figures versus those for CRM suggested again that the two companies’ growth trajectories are likely not that different in their respective start-up phases.
However, from a business perspective, CRM’s business model is less attractive than ORCL’s and suggests that CRM may face a more rapid growth slow-down than did ORCL. Specifically, CRM’s products “bolt on” to a company’s systems, versus being integrated with them as in the case of ORCL. Integrated software is difficult to replace (see our Valuation Notes for Oracle that liken its business model to that of a pacemaker manufacturer), and this difficulty makes switching costs very high. CRM’s products’ switching costs are not nearly as high, which increases customer churn. As competition from other providers (including ORCL) heats up, higher customer churn encourages companies to offer discounts to save the sale and increased discounts often lead to slower revenue growth.
Considering these points, we settled upon the following best- and worst-case scenarios for its revenue growth:
- IOI’s best case revenue scenario generates an average year-over-year (YoY) nominal growth rate and 5-year compound annual growth rate (5Y CAGR) of 35%.
- IOI’s worst case revenue scenario generates an average YoY nominal growth rate and 5Y CAGR of 23%.
Graphically, CRM’s history and our assumptions are represented like this:
 |
| Historical and Projected Rates of Revenue Growth for CRM Source: Company statements, IOI analysis |
Economic Profit Scenarios
IOI’s estimate of economic profit deducts an estimate of maintenance capital expenditures from cash flows from operations.
Reading various blog postings regarding CRM’s value, it is clear that the company’s last few years of accounting-based operating losses and eternal astronomical price-to-earnings ratios confuses a lot of investors.
It turns out that economic profits, as IOI measures them, are actually fairly high. However, two sources of cash flow based IOI economic profit are contentious, especially to value investors: deferred revenues and stock compensation expense.
Deferred Revenue Adjustment
As discussed in the section above, CRM’s subscription-based business model makes its accounting revenues appear smaller than they would for a firm that licensed its software. Costs that are associ
ated with particular contracts (like the commissions due to salespeople) can be recognized “ratably” during the same time revenues are. However, there is a large chunk of costs (administrative, programming, etc.) that are recognized immediately as they are incurred.
The effect of this timing difference is that revenues (which must be recognized gradually) appear small in relation to the costs (most of which must be recognized immediately), so the income statement shows extremely low profitability.
IOI’s definition of economic profit is based upon cash flows, so we can sidestep these recognition timing issues as long as we do so with open eyes. There is a large positive “Deferred Revenues” line in the cash flow statement that shows the unrecognized revenues which have nevertheless resulted in cash inflows. Technically, until CRM fulfills its obligations to provide software services to clients, some part of these revenues may have to be paid back to clients so should not be counted as positive inputs toward profit. However, practically, these revenues will all be recognized eventually, so there is a case to be made to simply treat the unrecognized revenues as the source of profits.
Including the cash flow associated with unrealized revenue in our definition of economic profit pushes the profitability up into a more reasonable range.
Stock Compensation Adjustment
Stock compensation does not cost the company cash, but must be listed as a cost on the income statement. The amount of this non-cash expense is added back in the operating cash flow section of the statement of cash flows.
Most value investors look at this source of funds as not reflecting “true” profitability. Their argument is usually based on semantics rather than economics, and while they have a point (to be addressed in the Investment Efficacy section), I feel completely comfortable treating the cash add-back associated with stock compensation as a source of owners’ economic profit.
The reason for this is that, by not spending money on salaries for its employees, CRM is increasing the cash on hand to make investments that have the potential to generate wealth for owners. Obviously, by issuing shares to employees, the company is diluting its existing shareholders’ interest in the company. We will address this issue in the Balance Sheet Effects section.
Once the stock compensation add-back is included in the definition of economic profit, we see that CRM generates roughly $0.20 in economic profit for every one dollar of revenue received. If you don’t like thinking about stock comp as “profit,” just read the above statement like this: “At the end of every year, CRM has about $0.20 to invest in potentially value-creative projects for every $1 of revenues it generates.”
Historical Economic Profitability
Looking at CRM’s economic profitability over time, it seems to be stair-stepping lower fairly quickly considering its short history. This trend may not be completely irreversible–it may be accepting lower profits early on to increase the size of its customer base–but considering the nature of CRM’s product and the competitive environment, there is reason to believe that it will be relatively hard for CRM to significantly improve its profitability.
Specifically, CRM’s bolt-on software has lower switching costs, and in such a competitive market, this lack of customer stickiness suggests CRM will face a structural difficulty in maintaining margins.
Considering all of this, IOI’s estimates of CRM’s historical economic profits and our projections for the future are as follows:
 |
| IOI Estimates of salesforce.com’s Historical and Projected Economic Profitability Source Company statements, IOI analysis |
The best-case scenario assumes that CRM will have developed a robust enough product and customer base that it is able to retain its pricing power in the face of competition. The worst-case scenario assumes CRM’s business faces a serious competitive threat from one or more competitors using price to gain market share.
- IOI’s best-case profitability scenario generates an average economic profit margin of around 17% over the explicit forecast period.
- IOI’s worst-case profitability scenario generates an average economic profit margin of around 13% over the explicit forecast period.
Investing Efficacy Scenarios
Because CRM is such a new company and because it is misleading to try to apply some terminal growth multiple to a company that is still not mature, we extended the stage two valuation time horizon to ten years rather than our usual five. This valuation thus looks at a period including 10 years of history, five years of explicit cash flow projections, and 10 years of implicit growth projections. Twenty-five years should be a long enough period to assume maturity of CRM’s business.
Looking at the history of the marginal growth of CRM’s economic profit versus nominal GDP–IOI’s usual means for assessing a firm’s medium-term growth rates–we were struck by two things:
- Periodic peaks followed by extended troughs.
- A low average marginal growth over time.
The peaks are a bit of a mystery. They may coincide with new releases of the software that allows the firm greater pricing power, or it may be an artifact of timing related to one of the balance sheet accounts governing operating cash flow. Whatever the peaks’ root cause, it seems odd that a company that is growing revenues so quickly would have as modest an average marginal economic profit growth rate as CRM.
The following is a graph of marginal growth of CRM’s economic profits. All three of the lines finish between the 10ppt and 20ppt lines, suggesting that economic profits are growing at a marginal rate compared to GDP in the mid-teens percent.
 |
| IOI Estimate of salesforce.com’s Marginal Growth in Real Economic Profits Source: Company statements, IOI analysis |
Taking these factors into consideration, we come to the following:
- IOI’s best-case medium-term (forecast years 6-15) growth scenario implies a growth in nominal economic profits of 12% per year.
- IOI’s worst-case medium-term growth scenario implies a growth in nominal economic profits of 8% per year.
- We assume that the present value of future projected cash flows will be spread over 30 million more shares than are presently outstanding (assuming a thre
e-year holding period) - Our worst-case estimates both for economic profitability and medium-term growth are intentionally low to compensate for the fact that worst-case share count increases will continue indefinitely.