
Transcript
As I was taking a look through my Twitter feed this morning, I found this tweet from a guy that I worked with at Morningstar for a while and who now runs a hedge fund – he was talking about Union Pacific’s free cash flow.
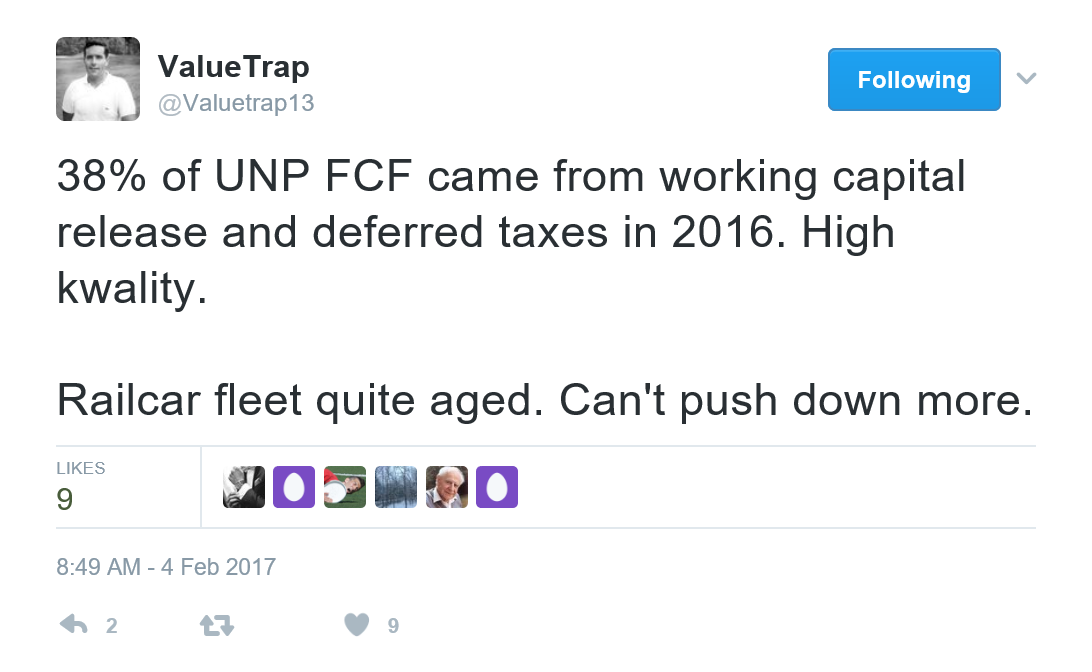
Figure 1. Source: Twitter, Charlotte Lane Capital
I did some work on Union Pacific back in May of last year, and published two reports on the company, so decided to take a look at Union Pacific to see how the company’s numbers had changed. I figured that if the hedge fund manager was writing something about Union Pacific’s free cash flow, the company had probably issued its latest 10-K – which in fact, it did just on February 3.
Most interesting to me is what the firm’s OCP margin was. OCP means Owners’ Cash Profits and this is the way IOI looks at profitability. OCP is a much more owner-centric way of viewing profitability compared to accounting definitions, and in fact, it is a lot like Warren Buffett’s measure, “Shareholder Earnings.”
To find out what OCP is, first we start with cash flow from operations – which Union Pacific calls “Cash provided by operating activities” – and we deduct an estimate of maintenance capex [N.B. “capital expenditures”], which we usually base on the total depreciation expense.
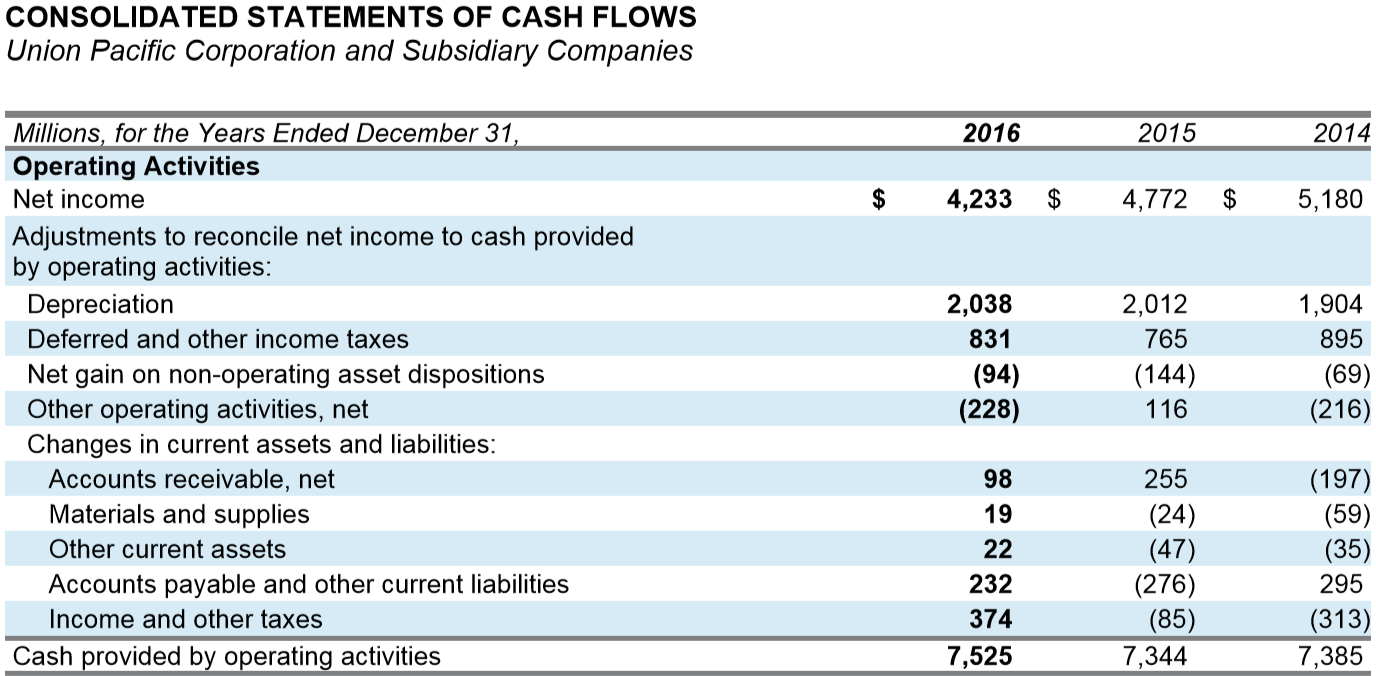
Figure 2. Source: Union Pacific Corporation
Doing that, I ended up getting a number of about $5.4 billion of owners cash profit. With over $19 billion of revenue, this works out to an OCP Margin of 27%. This profitability is phenomenal!
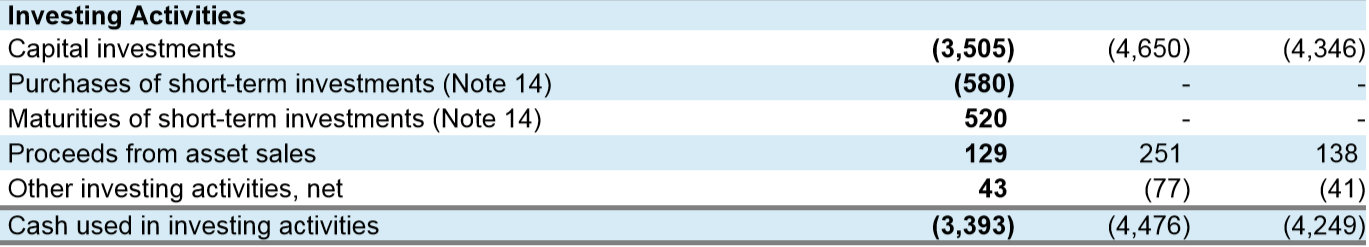
Figure 3. Source: Union Pacific Corporation
The other thing that I noticed about Union Pacific was that it really cut back on capital spending this year. In this figure, you can see capital investments of $3.5 billion. That’s a billion less than they spent in the year previous, and they also sold about 129 million of assets (which counts as an offsetting inflow to cash spent on equipment).
I always also look at what I call “Antidilutionary Stock Buybacks” and figure that the company probably issued shares worth about $150 million their executives [N.B. This number was calculated from another part of the financial statement]. In other words, the company basically paid for their executives’ bonus compensation out of the asset sales.
Still, I was really impressed that the company was able to generate such strong profitability.
I rolled our model and still have the same view of Union Pacific that I had back in May, but now the stock is trading for $10 – $15 more [N.B. Actually $27 more!]. As such, I’m starting to take a look at a possible bearish investment in Union Pacific.
Now all there’s one last thing as I was looking through not only the financials, but also through the presentation that management made regarding their 2017 freight volume outlook. I haven’t listened to the call yet or read through the call transcript, but I was interested to see the that they’ve got a minus by “International Intermodal.”

Figure 4. Source: Union Pacific Corporation
Of course, we talked about this in our Trump-Era investing report published in November. If a trade war starts, Union Pacific actually makes a lot of money from goods that are shipped into US ports on the West Coast and transported by rail across the country to Chicago and then on to the East Coast.
This “Intermodal” segment is a high profitability business for Union Pacific, so any messing with trade, or any talk of trade restrictions between Asia and the United States or Mexico and the United States stands to harm Union Pacific.
To the extent that produce, cars, car parts, and so forth are transported by rail, an interruption in trade is bad news for Union Pacific.
This dynamic is one more thing to think about when I take a closer look at our near-term forecasts and refresh our ChartBook report in February.
Okay, thanks for joining me today for Sunday Morning Coffee with Erik!