
In mid-October, Goldman Sachs – nicknamed “The Vampire Squid” by journalist Matt Taibbi – issued an industry report with opinion changes on several solar power companies. An IOI member – a retired solar power executive who owns a significant stake in one of Goldman’s downgraded firms – called me to try to make sense of the analyst’s change of opinion and to frame the valuation arguments the analyst was making.
It turns out that there is a lot to unpack in this downgrade announcement – with lessons regarding the structure of the investment banking business, the behavioral biases that influence even experienced analysts, and shortcomings in the way a lot of investors – “pros” included – value companies.
This article will focus on the valuation issue and one last structural issue. We discussed some background to the downgrade and wrote about the structural and behavioral issues behind the downgrade in this Forbes article.
Portrait of a Wall Street Valuation
In our previous article, we made the point that Wall Street analysts are not concerned with providing excellent investment advice. Their only job is to boost transaction flow through the investment banks sales and trading desks. This is just a fact of life in the Investing-Industrial Complex (download a PDF copy of the image below.
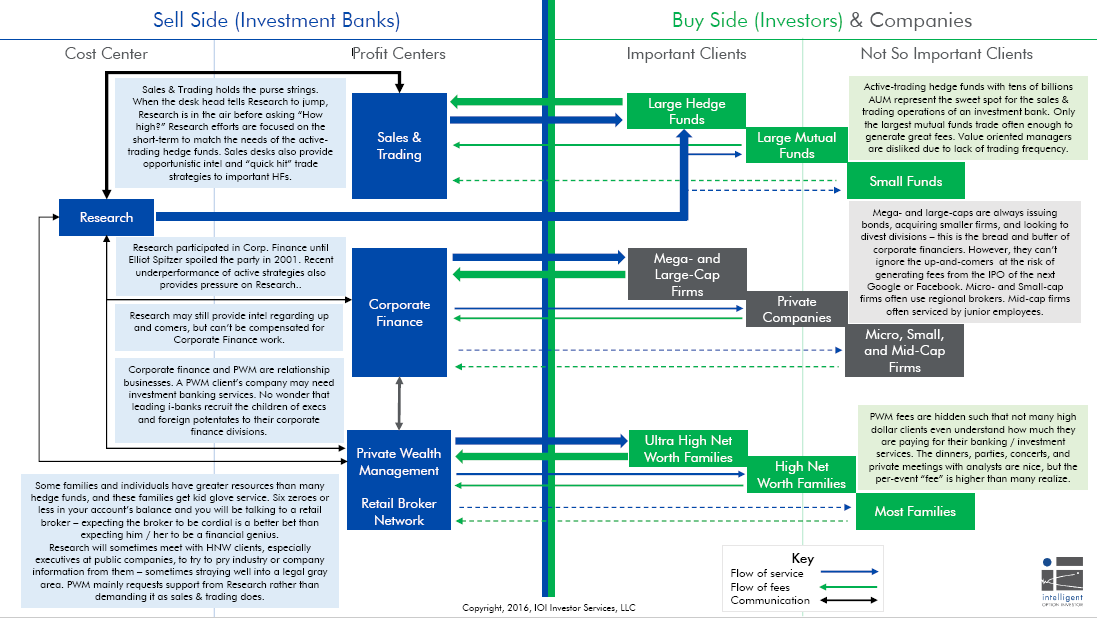
Figure 1: An overview of the “Investing-Industrial Complex”
It only stands to reason that a Wall Street valuation will be “flexible” enough to make sure that an analyst has plenty of opportunities to find reasons to transact in a company’s shares. This flexibility is beautifully provided by something I call “Ratio Analysis” and talk about in another Forbes article entitled The Three Great Investment Fantasies.
The idea behind Ratio Analysis – the method Goldman and all other sell-side analysts use in research reports – is that the price of all stocks will tend toward a normalized level of some operational factor like sales or earnings. The price-to-earnings ratio normalizes the price of a stock by the earnings-per-share, and over fairly short time periods – like 90 days – this normalized value will be pretty stable.
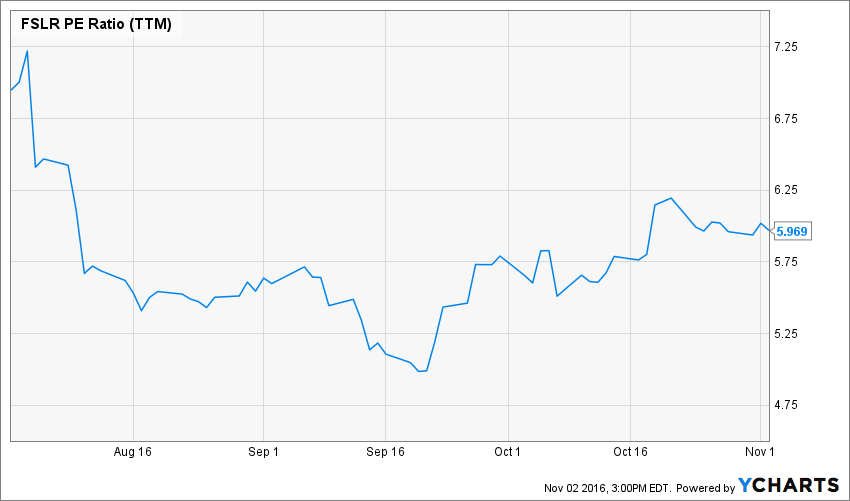
Figure 2. First Solar (FSLR) PE Ratio, 3-month timeframe
With a chart like that, any investor with a spreadsheet can quickly find an average value for the series (5.7 in this case), buy when the stock falls too far below, and sell if it rises too far above. For a Wall Street analyst trying to drive transaction volumes through the sales and trading desks, this investment plan is ideal! Prices change every day, so there is always the chance that there will be a new buy or sell sign triggered.
But this is just the half of it! Companies in the US are required to report quarterly results to their shareholders. This means that once every 90 days, the operational number in the denominator of the ratio (like earnings in a PE Ratio) changes, giving rise to the possibility that the value of the ratio will suddenly change. Not only that, as time passes, the analyst might think of reasons why to reconsider the valuation multiple for the stock, which will also make the ratio change. This gives a Wall Street analyst another two levers to pull to drive traffic through the trading desk!
While Ratio Analysis is great for investment banks, is it good for investors? My answer is “No”!
The first problem is one with the original premise – that normalized price ratios stay fairly stable over time. One glance at the next graph should convince you that is not so.
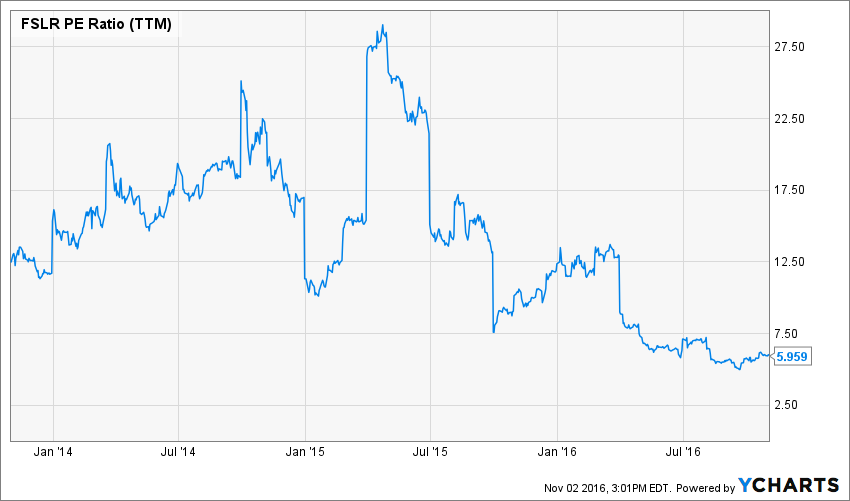
Figure 3. First Solar (FSLR) PE Ratio, 3-year timeframe
PE Ratios over a 3-year time frame are all over the place – from the current level around 6.0 to all the way above 27.5! Clearly, financial ratios are not constants of nature, and as long as you plan to hold an investment longer than a few weeks (Buffett mentions that his favored holding period is “forever”), you can’t automatically rely on a certain company’s financial ratio to return to some arbitrary mean value.
The next problem is one of transparency. It turns out that a PE Ratio actually is another way of expressing likely future growth of a company’s earnings. No one (except me) talks about it that way, so no one bothers to ask “What does this PE Ratio imply about future growth of earnings?” In the case of First Solar, the PE Ratio of 6 implies that the company’s earnings are going to decrease by 7% per year in perpetuity!* While it is tough to say whether a PE Ratio of 6 is appropriate for any particular company, it is hard to believe that First Solar’s earnings are going to decrease at this quick a clip forever! The lack of transparency regarding the implied future growth rate is a big disadvantage to Ratio Analysis, especially because the vast majority of the value of any firm lies in our assumption that the firm is a “going concern” and will continue to operate indefinitely.
So, now that we understand a little about the background regarding what constitutes a “reasonable” Wall Street valuation, let’s take a look at the Goldman analyst’s valuation of First Solar.
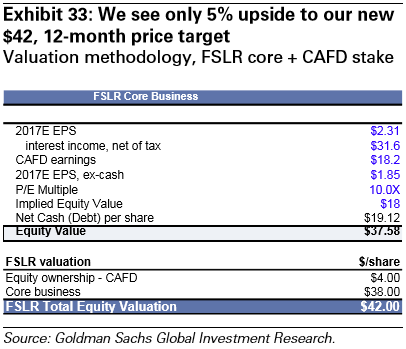
Goldman’s valuation analysis of First Solar – five pages of text and complex graphs – boils down to the 10 rows of the table above. Multiply Goldman’s estimate of First Solar’s 2017 earnings per share by an arbitrary value of 10.0, adjust for cash on the balance sheet and the assumed value of First Solar’s ownership of another company (which was calculated in exactly the same arbitrary way) and you’re done.
The IOI member who originally asked me about this valuation was incredulous. “You mean that the analyst only takes one year of results and bases his price target on that?!” “Of course,” I answered, forgetting momentarily that most investors never realize how flimsy most Wall Street analyses are. By the way, the analyst was being generous with his target ratio of 10.0 – this ratio implies that the company’s earnings will not decline in perpetuity, but that they will simply never grow again.
Imagine you went to the doctor with a cold. After carefully considering your symptoms, the doctor announces that you won’t get any worse, but that the cold is terminal and you will never fully recover. This is Goldman’s “diagnosis” of First Solar.
Structural Effects: Dumb Money Investments
In my last article, I focused on structural issues related to the way that financial professionals get compensated. There is, however, another structural effect getting a good bit of attention in the world of professional investors lately – that of the proliferation of passive ETF investing. Investing professionals call this “dumb money.”
I’m not saying that ETF investing is dumb – I counsel IOI clients to reserve most of their investment allocations to low-cost indexes, and think ETFs are often great tools for that. However, buying or selling an ETF is fundamentally different from making a conscious decision to become the owner of a company – exactly the role a good investor takes when he or she invests.
First Solar is a member of various ETFs and indices. People who are investing in these baskets are not interested in First Solar’s future growth rates or even its PE Ratio. Many of them are investing in anecdotes such as “Oil is cheap right now / clean energy subsidies might go down / it’s been raining a lot lately, so I don’t want to be invested in solar.” As people make broad-brush investment decisions and express them with security baskets, the baby can and does get thrown out with the bathwater. (For the finance nerds out there, this is precisely the root of the so-called Grossman-Stiglitz Paradox which may be paraphrased as “If everyone stops looking for mispriced stocks, stocks become mispriced.”)
Between the investment banks using self-serving and ridiculously short-sighted valuation methods and a dumb money world where investors that are not looking carefully at the companies they are buying, we believe there is an increasing tendency for stocks to become mispriced. An environment with many mispriced stocks ends up being very good news for intelligent investors!

Figure 4. Nobel Prize winner, Joseph Stiglitz
* Note: Here, I’m using a discount rate of 10% and the Gordon Growth Model.
This article originally appeared on 