
Last summer, we published a Tear Sheet suggesting a covered call “Bond Replacement” investment in IBM. The option we highlighted expired In-the-Money (ITM) and below our Effective Buy Price in October 2015. On October 18, we published a follow-up article discussing portfolio management of this investment.
IBM issued its annual report late last month, and we have taken some time to analyze the statements and to refresh our model. While our investment thesis has not changed, we have pulled down our fair value range, and are using this article to detail what has changed in our opinion.
We have also published another Tear Sheet on IBM, so please see that in conjunction with this article.
The key take-aways from this article are:
- Continued uncertainty related to IBM’s revenue growth is the key driver in shifting our fair value range downward slightly.
- IBM’s profitability during 2015 was even better than our near-term best-case scenarios. We have not changed our profitability assumptions since we cannot yet be certain that these profitability increases are durable, but are impressed at last year’s improvement.
- We were impressed by the level of investment efficacy demonstrated by IBM, despite the company’s strategy upheaval.
Valuation
Our original valuation range was $159 / share in the worst-case and $235 / share in the best-case. Because it seemed that IBM was on track to hit the higher end of our near-term profitability scenario, we showed the “most likely” fair value slightly skewed to the up-side, at a value of $212 / share.
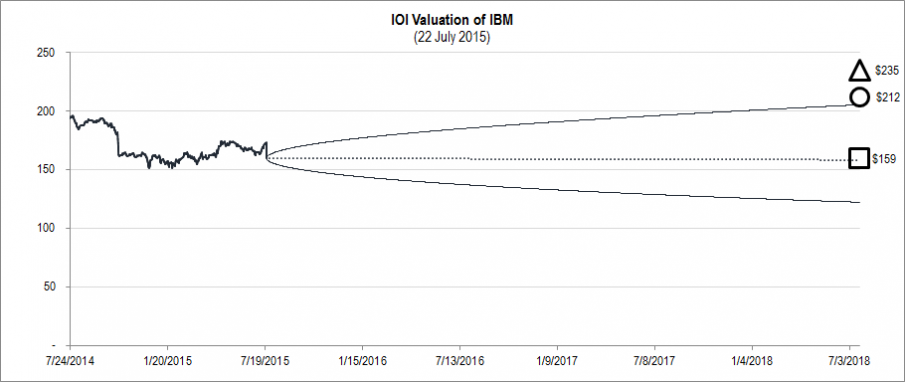
Figure 1. Source: YCharts, CBOE (data), IOI Analysis
Our most recent valuation range is much tighter, with a running from $155 / share on the low side to $185 / share on the high side.
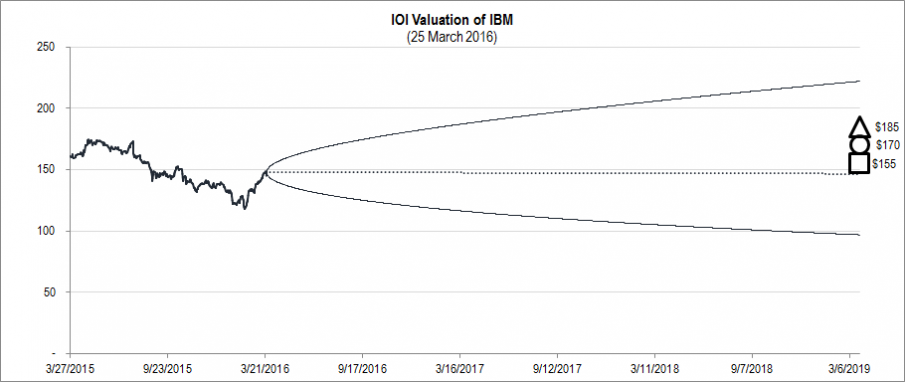
Figure 2. Source: YCharts, CBOE (data), IOI Analysis
We actually believe we are likely being too cautious with our best-case valuation for reasons we discuss below. You will notice that in addition to a much tighter grouping of values and a wider BSM Cone (reflecting added option market uncertainty), we are pegging the “most likely” value as the average of the most-likely best- and worst-cases.
Unlike our previous valuation, where we showed the full low-to-high range, in our previous valuation, we have discarded the lowest valuation scenario as extremely improbable and have not shown a $135 / share valuation on the low side and a $198 / share valuation on the high side. Reasons for these decisions are discussed below.
The midpoint of the earlier valuation was $198 / share; the midpoint of the present valuation is $170 / share. This change represents a decrease of 14%.
Revenues
In our July 2015 analysis, we estimated IBM’s revenues would fall between $81.6 billion in the worst-case scenario and $82.6 billion in the best-case scenario. Actual 2015 revenues were just shy of $81.8 billion, partially influenced by a foreign currency headwind (which I wrote briefly about in this article). Visually, you can see that actual values were much closer to our worst-case assumption:
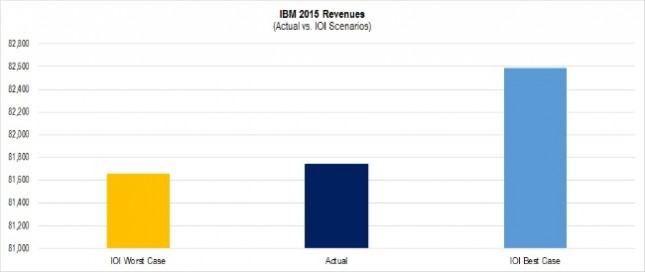
Figure 3. Source: Company Statements, IOI Analysis
Everything I have been able to find paints a strong demand picture for IBM’s “strategic imperatives” business, but a shift to a different service offering and from on-premise software to Cloud software muddies the overall picture. Because of the lack of visibility into the overall demand environment, we have decreased both our best- and worst-case revenue assumptions in our new model. This change represents the single largest driver for our reduced fair value range.
A comparison of our 2015 best- and worst-case revenue assumptions and our new best- and worst-case assumptions are pictured below:
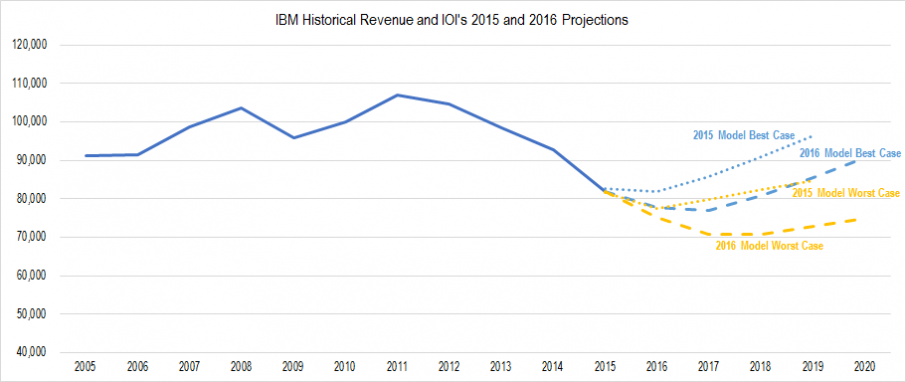
Figure 4. Source, YCharts (data), IOI Analysis. Dotted lines represents IOI’s 2015 assumptions; dashed lines represent our most recent assumptions. Blue is used for best-case, gold for worst-case.
As you can see above, our present best-case revenue scenarios imply lower aggregate revenues over the next four years than our previous worst-case model did. Considering that we have not adjusted any projections to reflect foreign exchange effects, we believe this might be too pessimistic of a scenario, but until we have better visibility into IBM’s demand and revenue picture, we believe this caution is warranted.
Profits
In our July 2015 analysis, we estimated IBM’s Owners’ Cash Profits (OCP) would fall on either side of $12 billion. Actual 2015 OCP came in at just over $14 billion. This is phenomenal. Keep in mind that actual revenues came in at near our worst-case value, so one might expect profitability to be weak as well. Instead, profitability actually exceeded our expectations — demonstrating that, at least this year, IBM had negative operating leverage (i.e., profits went up even though revenues fell). A visual comparison of actual OCP to our best- and worst-case scenarios is below.
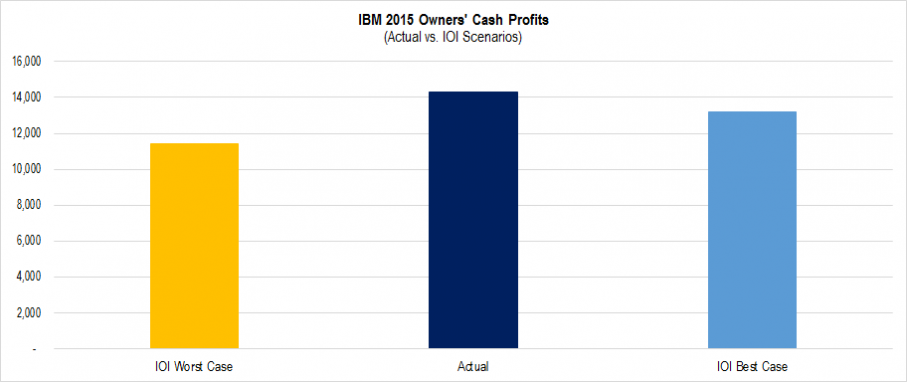
Figure 5. Source: Company Statements, IOI Analysis
We believe that the company’s OCP may be positively influenced by the shift of some of its revenues from on-premise software (whose revenues can be recognized immediately) to Cloud software (whose revenues must be recognized ratably). The details regarding why this would affect OCP positively is better left to an IOI Master Class in Valuation. Suffice it to say that because we have limited visibility into this area as well and because a boost in OCP due to this effect would decrease over time, we have decided to maintain our profitability assumptions even though they were measurably incorrect in our 2015 projections.
A comparison of our 2015 best- and worst-case profitability assumptions and our new best- and worst-case assumptions are pictured below:
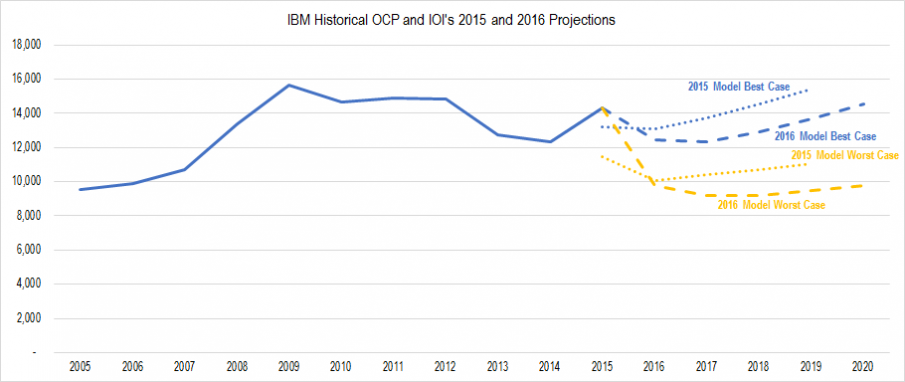
Figure 6. Source: Company Statements, IOI Analysis
These profit figures may look as though I am being conservative. However, I despise conservatism in analysis — I would rather be right than either aggressive or conservative!
At the present time, however, I do not believe I have the information necessary to be any more accurate, so I will leave our margin projections (16% OCP margin in the best-case and 13% OCP margin in the worst) as they are until I have a clearer picture of the actual economics.
The possible tailwind from foreign exchange effects on revenues and the likely increase in profitability lead me to continue to believe that IBM’s value is skewed toward our best-case valuation; the sources of uncertainty mentioned lead me to wait before making material changes to my formal valuation assumptions.
Investment Efficacy
IBM’s investment level for 2015 was fairly high and in consideration of IBM’s needed investment spending (mainly for acquisitions), I have boosted our assumptions for investment spending as a percentage of profits from 20% in the July 2015 model to 25% in our most recent model. This is a hard measure to accurately forecast for a firm undergoing a major transition, but I think our assumptions for from between one-fifth and one-fourth of owners’ profits being used for investments is in the right ballpark. Changing investment level assumptions to 20% in our most recent model boosts the equally-weighted “most-likely” fair value estimate by around $5 to $181 / share. Suffice it to say that it is ridiculous to try to achieve this level of precision in a fair value adjustment…
In looking at the graphs in our updated model, we were pleasantly surprised to see fairly good historical investment efficacy at IBM (IOI 100-Series participants will know that we measure efficacy by comparing growth of profits to a standard economic yardstick). Here is that graph.
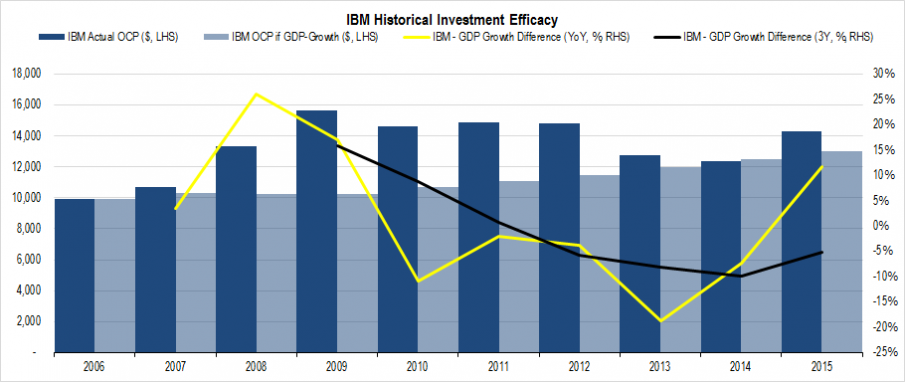
Figure 7. Source: Company Statements and YCharts (data), IOI Analysis
Even with the great upheaval in IBM’s business and an enormous amount of hand-wringing and gnashing of teeth in the investor class, IBM’s profits have grown well over the past nine years.
Note that this article is free to visitors to IOI’s site today, but will be restricted in future to IOI subscribers!
To Learn More, Contact Us!