
Union Pacific has drastically improved its efficiency in converting revenues to profits over the past 10 years.
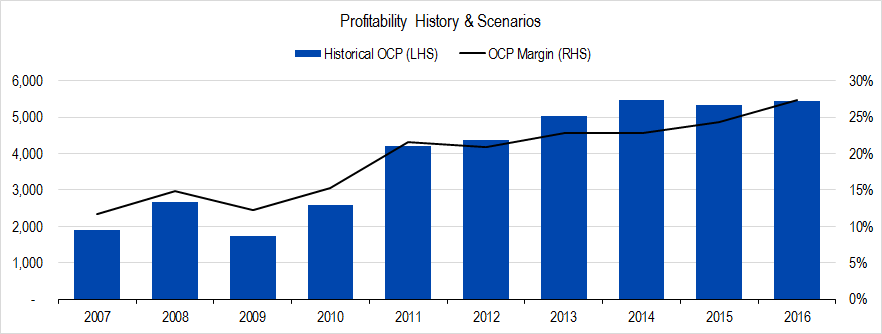
Figure 1. Source: Company statements, Framework Investing analysis
Profitability for the first four years of this series were stable in the low- to mid-teens region in terms of Owners’ Cash Profit (OCP) margin. Then, in 2011, the level jumps to the low- to mid-20% range and stays there through 2015.
Whenever I see this kind of a change, I want to figure out what’s going on and a good way to do this is to decompose the change of OCP into its various elements. OCP is most influenced by three inputs: Net Income, Depreciation, and Changes in Working Capital.
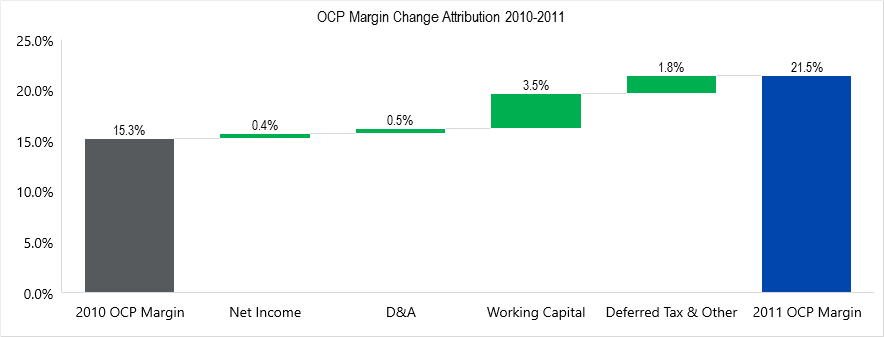
Figure 2. Source Company statements, Framework Investing analysis
In figure 2, we can see that all these factors contributed to the jump in profitability in 2011. Its profit margin increased by 0.4 percentage points or 40 basis points, it reduced its depreciation and amortization, which boosted OCP by 50 basis points, changes in working capital added 3.5 percentage points, and deferred taxes and other items contributed 1.8 percentage points.
Out of all these items, the change in working capital and the deferred taxes are, in my mind, the least important from a business perspective because both these categories are transitory – they flip back and forth from year-to-year. An increase in profit margin – what I have labeled “Net Income” is the most important because it shows that the company is increasing how efficiently it converts revenues to profits. If consistently lower depreciation and amortization is generating increases in OCP margin, I get worried that the company may be underspending on maintenance capital expenses.
Looking at this 2011 attribution, my impression is that the profit improvement is mostly transitory. All things held equal, I’d expect working capital and deferred tax to revert over subsequent years, which would bring the profitability level back down. But I recall that Union Pacific maintained the 20% range OCP margin for several years, so this graph – suggesting a temporary change – confused me. I decided to look at 2012 in the same way.
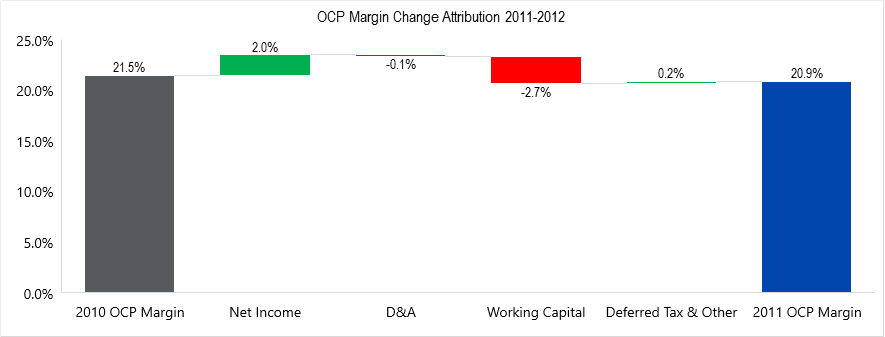
Figure 3. Source: Company statements, Framework Investing analysis
Here, there are two things we notice. First, working capital did indeed revert – acting as a headwind to OCP profitability. That is the transitory effect I had expected. However, not also that Net Income provides an offsetting tailwind. In other words, the company became more efficient at converting revenues to profits that year and that profitability profile became a durable facet of the company’s operations. To me, even though we saw OCP shoot up in 2011 from the teens to the twenties, the most important shift in profitability was in 2012, when the company was able to maintain its higher profitability level.
Looking back at our model, the other thing that bothered me looking at these numbers is the 2016 OCP margin of 27%. In my original model, which I did in early 2016, when only 2015 numbers were available, I forecast a worst-case OCP margin of 23% and a best-case of 27%. In fact, I thought the 27% OCP margin would be kind of a stretch for the company to achieve, but only eight months later, the company reported exactly that.
I decided to look at the decomposition for 2015 to 2016 to see whether this profitability boost was likely to be transitory or durable.
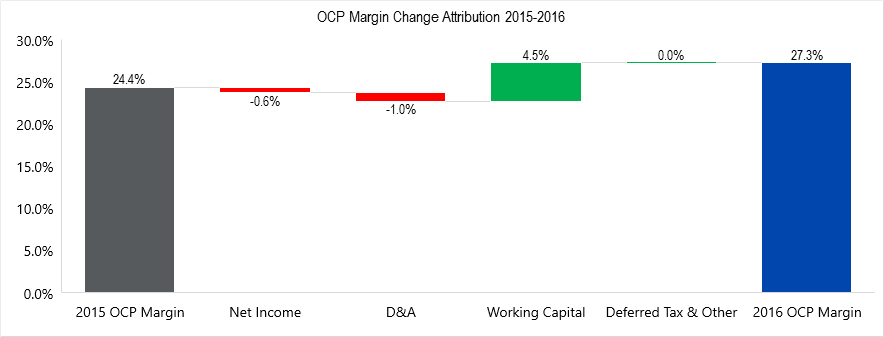
Figure 4. Source: Company statements, Framework Investing analysis
Looking at this graph, the thing that jumps out at me is the massive influence of working capital on the profitability. Because we know that the change in working capital is a transitory item and also largely under the control of management, my opinion now is that the increase in profitability in 2016 is a one-off occurrence. I happen to think that this cash inflow from working capital is also probably prompted by management’s concern about business conditions – they are battening down the hatches and trying to preserve cash in case of a business shock.
I may be wrong about this – the company may be readying itself to improve profit more durably – so my focus on Union Pacific’s profits this year will be on comparing my assumption to the firm’s actual results.
DISCLOSURE: The author holds options expressing a bearish opinion about the price of Union Pacific’s shares (UNP) versus the company’s long-term intrinsic value.