
[This article originally appeared in Forbes]
Analyzing companies like National Oilwell Varco (NOV), whose businesses are tied to mysteriously fluctuating commodities prices is notoriously difficult for the simple reason that attempting to predict commodity prices is always a great way to look like an idiot.
Luckily, the IOI valuation method sidesteps the problem of looking like a fool by making use of best- and worst-case scenarios for each of our three main valuation drivers: near-term revenue growth and profitability, and medium-term cash flow growth. (We will be publishing a more in-depth report about NOV in the near future, and will be holding a web conference to discuss it.)
Scenarios allow us to avoid a damaging behavioral bias known as anchoring and to view the investment from a more scientific perspective – observing actual operation conditions versus our scenarios – as time passes.
The most important scenarios for a valuation of NOV are those for oil prices. As we pointed out in our last article about NOV, its “best” revenues (high-dollar projects that generate the company’s highest profits) come from equipment for offshore rigs in deep water. Deepwater wells are phenomenally productive and long-lived compared to “fracked” wells, but they are also enormously expensive to develop, so oil prices must be at least double, and likely closer to triple, what they are now before exploration and production (E&P) companies will find it worthwhile to start deepwater projects again.
In our best-case scenario, shown below, we have oil prices recovering to $60 / barrel (bbl) by the end of 2016 and stabilizing there before heading back up to the $90 / bbl range. This would make offshore projects attractive again and spur the construction of new drillships and platforms – this in turn would provide a boost to NOV’s revenues and profits.
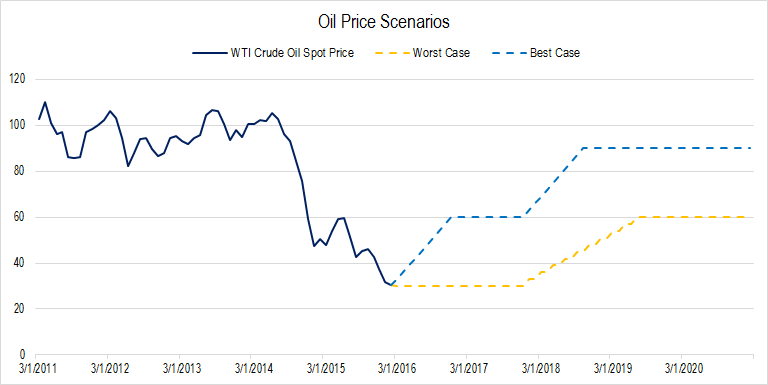
Figure 1. Source: YCharts data, IOI Analysis
In our worst-case scenario, supply remains high through 2017 and prices stagnate in the $30 / bbl range. Eventually, prices recover to the $60 / bbl level in this scenario, but take a while to do so.
(Looking at the graph above, you might think we’re too optimistic on the worst-case scenario. From speaking with people in the oil industry, we know that oil at $30 / bbl for as long as we’ve projected in our worst-case scenario would have extremely negative effects on the financial health of American energy companies. We have not considered an “Armageddon” scenario, but many in the oil business still look at our worst-case production and shudder.)
With these scenarios in place, we started thinking about what both best- and worst-case effects on NOV’s two near-term valuation drivers would be. This got the ball rolling with our step-by-step valuation (see other examples on Oracle, IBM, Ford, Wal-Mart, and Whole Foods).
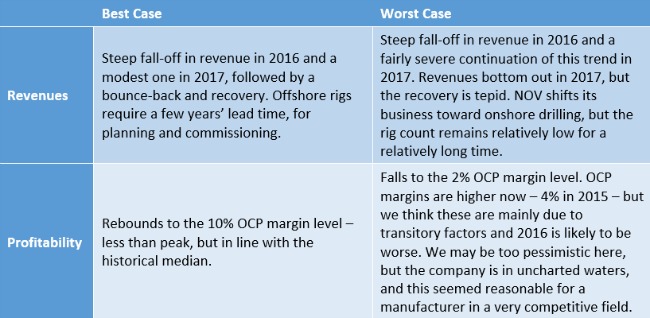
For our one medium-term valuation driver – growth in cash flows in years 6-10 – the range is again wide. Worst-case, we have 5% per year – what we consider a normalized level for nominal GDP growth. For best-case, we have 15% per year – equivalent to a bounce-back up-cycle, but not to the level of a run-away boom in oil prices.
These scenarios generate a very wide valuation range between best and worst cases.
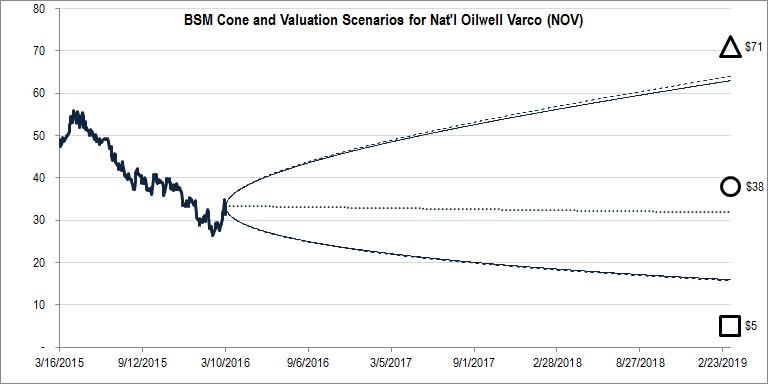
Figure 2. Source: YCharts, CBOE data, IOI Analysis. Cone shape represents the option market’s forecast for the range of NOV’s stock price in the future. IOI’s best-case valuation shown by a triangle, worst-case by a square, average value by a circle.
For an investor with only stocks in his or her toolkit, this sort of valuation scenario would be uninvestable. The stock is trading in the mid-$30 range; worst-case is around $5 / share and best case is around $70 / share. If you invest in the upside scenario, but the downside scenario ends up playing out, you’ve lost a lot of capital – and vice versa.
But one of the wonderful things about options is their flexibility and the power they give an investor to make choices about how to invest in both the upside and downside potential of a stock. We have warned our readers that we consider this a speculative investment, but the one-page Tear Sheet we recently published pointed out the possibility of investing using what is known as a “strangle” – simultaneously buying both a long-term call and a long-term put option.
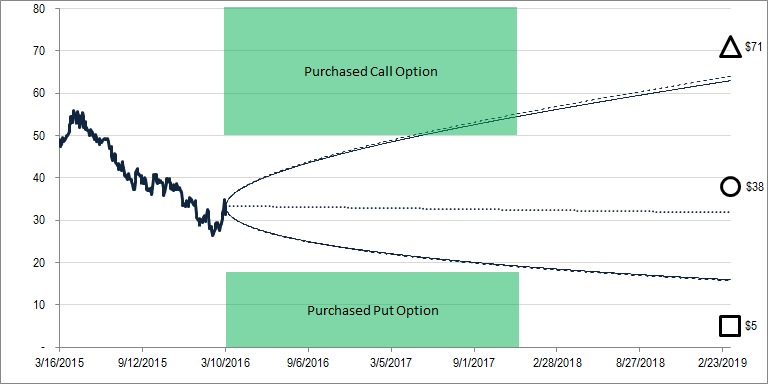
Figure 3. Source: YCharts, CBOE data, IOI Analysis
With this investment structure, whether our best- or worst-case comes to pass, we may be able to realize a profit and tilt the balance of risk and reward in our favor.
To learn more about IOI’s unique approach to business analysis, valuation and the use of options, contact us here: