
This overview accompanies the IOI Tear Sheet on Mueller Water (MWA) and is split into the following sections:
- Revenue Scenarios
- Economic Profit Scenarios
- Investment Efficacy Scenarios
- IOI Conviction Level
IOI?s explicit forecast period for Mueller lasts five years. Our stage II implicit forecast lasts 10 years for reasons discussed below.
Revenue Scenarios
When I attended Vitaliy Katsenelson‘s VALUEx Vail conference several months ago, an investment fund manager from L.A. gave a presentation on a company of which I had never heard–Mueller Water. The idea sounded so interesting I couldn’t help taking a look at the investment myself.
Mueller is basically a fire hydrant producer, but also manufactures other iron and brass water infrastructure products. There are a few reasons why the VALUEx presentation caught my attention:
- It seems like a simple, straightforward business with a long history and a stable competitive environment–the last new entrant into this market was sometime near the turn of the XX century…
- MWA is dominant in its field, with somewhere around 50% market share in fire hydrants.
- MWA’s products are such a high quality that they are specified by municipalities looking to replace or add hydrants and other equipment to their water systems.
- The fund manager made a convincing argument regarding replacement demand for water infrastructure in the U.S.
It turns out that the picture is a bit more complicated than I believed at first, but this company may still be an attractive investment, depending on the replacement demand picture and on future housing starts.
MWA’s present business is split between the Mueller division (which produces the hydrants and other industrial products) and Anvil (a smaller, less profitable division that produces accessories like hangers and fittings for pipes in commercial locations).
Revenue growth at the Mueller division–arguably the more important in terms of revenue and profitability percentage–has shown a high correlation with housing starts, specifically those in the Northeast and South.
 |
|
Mueller segment revenue versus housing starts
Source: Company statements, US Census, IOI Analysis
|
Correlations are in the 80% range, suggesting that nearly 70% of the variation of Mueller division’s revenue can be explained by housing starts in these two regions. Since various incarnations of Mueller were founded in the Northeast, the South, and the Midwest, it is no surprise that these are the three regions displaying the highest correlation to Mueller’s revenues. In the process of winning municipal bids, it is not hard to imagine a local firm has an advantage by virtue of political connections. This correlation could be coincidental, however, and I may be wrong about Mueller’s geographical dispersion; the company does not provide any data on this and I was unable to find hard figures despite some considerable searching.
The good news is that if Mueller does have exposure to the Northeast, where water infrastructure is oldest, it is likely they will have the advantage of an incumbent at winning bids for replacement work. The bad news is that the Northeast is the slowest growing in terms of new building, however, this weakness may be offset by presumed exposure to the larger, more quickly growing South.
This brings up the question of replacement demand. I will address this issue more in the investing efficacy section, but let’s set the stage by taking several of graphs published by the EPA in its 2002 analysis entitled The Clean Water and Drinking Water Infrastructure Gap Analysis (hereafter “EPA Analysis”)
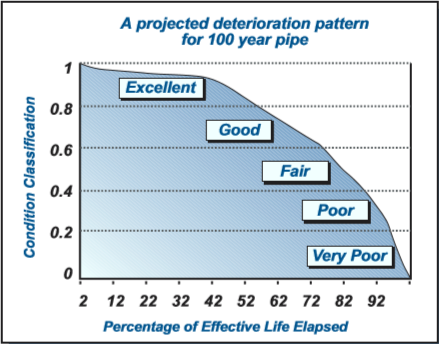
First, here is how the EPA classifies pipe in terms of useful life:
 |
| Source: EPA Analysis |
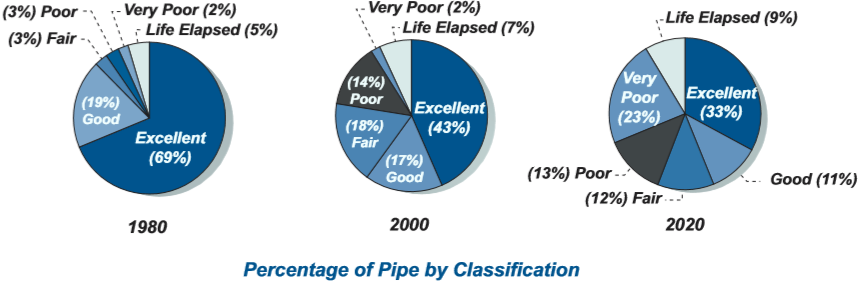
And here is the EPA’s projections for the state of drinking water pipe in three time periods:
 |
| Source: EPA Analysis |
From the above, you can see that by 2020, the EPA projects that 45% of the pipe in the U.S. will be classified as either “Life Elapsed”, “Very Poor”, or “Poor”, suggesting a strong demand for replacement parts.
The EPA, in fact, estimates that replacement demand will peak in around 2040, but that it will increase by a factor of roughly three times over the next fifteen years.
 |
| Source: EPA Analysis |
Obviously, there are a host of assumptions that go into a graph like this, but it is clear that, in terms of directionality, the EPA is expecting for there to be much higher demand for water infrastructure in the next fifteen years, and a large portion of this demand will be for products that Mueller sells (not only hydrants, but also valves, components, metering systems, etc.).
The last thing that stood out to me regarding the VALUEx Vail Mueller presentation was the point that municipalities actually specify Mueller products when soliciting bids. While I found this to be true, the actual story is more nuanced. For example, I found the following document on the San Antonio Water Authority’s (SAWA) website regarding bids for fire extinguishers.
 |
| Source: SAWA |
So, it’s obvious that Mueller is among the approved products that have the right to bid for a particular project, but it is not as though Mueller’s products are the only one’s accepted by a given municipality.
Because Mueller is such a storied company, I thought that finding historical revenue data would be relatively easy. Unfortunately, since its inception, Mueller and its segments have been taken private and sold to other companies to become divisions of these firms countless times, so finding good historical data is tricky. The firm IPO’d most recently in 2006 in a complex transaction and almost immediately after the IPO, housing starts collapsed. Mueller sold its U.S. Pipe division in 2012, further complicating the historical revenue picture.
I did find comparable revenue data for the remaining two divisions, and also found an interesting tidbit of data on the corporate website. On a timeline of various company milestones, there were years that marked when the millionth, two-millionth, and three-millionth fire hydrant sold.
Looking at these data, I estimate an organic nominal growth rate for Mueller’s business to be on the order of 6%.
Our worst- and best-case revenue scenarios use the above assumptions for the years 2014-2017. A graph of these projections, compared to historical levels are as follows:
 |
|
Historical and Projected Revenues for MWA
Source: Company Statements, IOI Analysis
|
- IOI’s worst case revenue scenario generates an average year-over-year (YoY) nominal growth rate and 5-year compound annual growth rate (5Y CAGR) of around 6%. This takes into account near-term replacement demand that is weaker than forecast by the EPA.
- IOI’s best case revenue scenario generates an average YoY nominal growth rate and 5Y CAGR of 10%. This represents the case in which replacement demand is strong.
Economic Profit Scenarios
IOI’s estimate of economic profit deducts an estimate of maintenance capital expenditures from cash flows from operations.
Because of the limited historical data available and considering that these historical data were taken during a time of extreme duress in MWA’s industry, estimating “normalized” levels of historical profitability is difficult enough, and projecting future profitability is an exercise in creative writing.
Excluding U.S. Pipe’s contribution to MWA’s economic profitability (U.S. Pipe’s contribution was consistently negative…), it looks as though the firm has generated a baseline EP of around 4% on average over the last three years. Considering that these three years have been bad one’s I use 4% as a worst case projection estimate. For best case projections, I thought that doubling the worst-case EP was a sensible guess, given the dynamics of the industry and the nature of products being sold. This estimate is contingent on a great many things including future tax rates, future debt levels, and future product demand. It is the uncertainty regarding baseline profitability that prompted me to classify this as a low-conviction investment. Here is a graph of historical and projected EP for MWA.
 |
|
IOI Estimates of MWA Economic Profitability
Source: Company Statements, IOI Analysis
|
- IOI’s worst case profitability scenario generates an average economic profit margin of around 4% over the explicit forecast period.
- IOI’s best case profitability scenario generates an average economic profit margin of around 7% over the explicit forecast period.
Investing Efficacy Scenarios
Mueller does not need to invest a great deal in technology, and during this trough period, has not needed to spend much of anything on capacity increases. If replacement demand is strong, we forecast about 1% of sales being used to expand production capacity. Considering the firm’s market position as a strong incumbent, it is likely that even this relatively small amount of growth capex will have high efficacy. However, again, because historical data for MWA and its competitors is not readily available, we have only been able to guess at future marginal growth rates for free cash flows. Taking into consideration the EPA analysis, we have extended the stage II abnormal growth period to 10 years rather than our usual five years in order to try to capture the lion’s share of the projected replacement demand.
With these assumptions, our estimates of real marginal growth of economic profits for MWA are as follows:
 |
|
IOI Estimate of MWA’s Marginal Growth in Economic Profits
Source: Company Statements, IOI Analysis
|
- IOI’s worst case medium-term (forecast years 6-15) growth scenario implies a growth in nominal free cash flows of 6% per year.
- IOI’s best case medium-term growth scenario implies marginal nominal free cash flows of 10% per year.
seems a shortage of lot’s is impacting Housing starts. Is this the impetus for new development infrastructure?
http://www.nahb.org/news_details.aspx?newsID=16444
Hi Contrarian Individual Investor,
Thanks for the comments and the link to the NAHB news–very interesting.
Certainly, this kind of a dynamic could set up MWA for more rapid growth in the new development market as property developers begin to acquire land again and set up the infrastructure required to attract home builders. However, I think the market may already be pricing a good bit of this into the stock’s price right now. To me, it looks like the stock price’s climb from $2 or so in 2011 to around $5 at the end of 2012 is market participants being happy that MWA could meet its debt obligations with the US Pipe spinoff. The move from $5 to where it’s been trading recently is probably the equity market realizing the the housing market will eventually recover. Of course, these kinds of assessments are completely arbitrary, but at least, that is how I frame it myself, and I think there is some reason to believe this is at least broadly true.
I think though, that an investment in MWA is much more related to a positional view regarding the replacement and renovation cycle for aging infrastructure. Especially eastern seaboard cities, whose water related infrastructure has been in the ground for a long time, will start need to replace rather than repair old equipment. If this does indeed happen, Mueller stands, I believe, to gain a great deal.
This kind of a paradigm shift has factors working both for and against it. The weakening position of the U.S. middle class and their changing attitudes towards suburban living would strengthen MWA’s position (assuming that the trend to move from the suburbs to gentrified urban areas continue). The fact that water prices have advanced much more rapidly than other utility prices in recent history and that municipalities and rate payers alike are strapped for cash, work to MWA’s disadvantage (if rate payers push back on infrastructure-related rate hikes). In the end, I thought the case for was stronger than the case against, but it will take a few years to see how this plays out.