
One of the most wonderful things about understanding option pricing is that you can quickly understand the market’s expected price outcomes for a particular stock at any time in the future.
My book, The Framework Investing, describes how one might read the option market’s tea leaves and gives an example. An astute reader, Sean, wrote in with a question about the mechanics of how to do this. Here is our exchange.
Question
Hi IOI team! I’m currently reading your book and have a question with regards to page 152 on the section “Delta: The Most Useful of the Greeks.”
In your book you stated that we should find the call strike prices with deltas closest to 0.16 and 0.84, and put strike prices with deltas closest to -0.84 and -0.16, following which we were supposed to sketch the distended BSM curve.
My question is if for example, we are looking at calls, won’t the 0.16 and 0.84 translate into 2 different strike prices? How does it end up becoming one point on the upper half of the BSM curve?
Moreover, on page 155, you stated that you eyeballed and extrapolated some values based off of the options screen. May I know how this process is done in greater detail please?
Thank you very much!
Erik’s Answer
Hi Sean,
Thanks so much for reading through my book so carefully and for the excellent questions!
You can think of “delta” as probability of a stock being at or above a certain level at a certain time. So 16-delta means that there is a 16% probability the stock will be at or above that price at expiration and 84-delta means that there is an 84% chance.
So, the 84-delta for a call shows the lower bound and 16-delta is the upper bound for a call. If you do the reverse for the puts, the -84 delta is the upper bound for them and the -16 delta is the lower bound. The calls and puts should show roughly the same thing – sometimes there is a small difference, but not enough to be an arbitrage opportunity – so usually I just pull data for calls.
As luck would have it, I just pulled together an example, so I’m attaching that graph here.
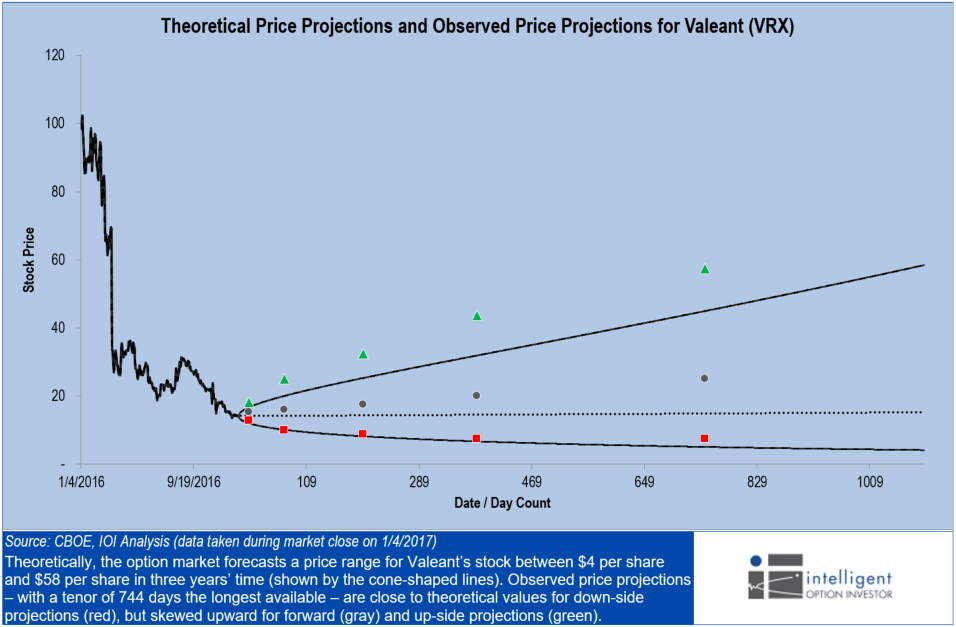
Figure 1.
For each of the expirations, I have just gone through, pulled the strike closest to 84-delta and set that as the upper bound, then pulled the strike closest to 16-delta and set that as the lower bound (I chose the 50-delta contract for the forward price of the stock…).
You mentioned my “eyeballing” the numbers… Here’s what I mean by that… Let’s say that I see a strike that is trading at 90-delta and the next strike trading at 82-delta (maybe 40 and 42.50 strikes respectively). I would say that 84 is closer to 42.50-strike than the 40-strike, so 84-delta is around $42.00 even.
This is not a very “sophisticated” way of doing this, but one of the things I talk about in our 100-Series courses is that option prices sometimes have very low “information content.” Pricing is not very tight – in other words, investors may not be paying close attention to whether a price for a particular option should be $1.05 or $1.10, so the deltas will also be approximate. Because of that realization, I don’t mind using eyeballed values to give me an idea about what the market probably thinks about the future price of a stock.
I hope this helps! Thanks again for sending in the question!
All the best,
Erik