
Transcript
We have recently published several pieces of research about Union Pacific – the largest publicly-traded railroad in the US – and have received so many questions about our valuation assumptions that we decided to summarize them here. This video is just a brief overview; for members, we have an in-depth, 20-part “Guided Tear Sheet” mini-course that looks carefully at each valuation driver as it relates to Union Pacific, also based on our valuation framework.
Our valuation framework focuses in on a handful of fundamental drivers, of which there are only three main ones in the short-term and one related one in the medium-term. We’ll work through each one-by-one.
Revenues
A wave of price increases brought about by deregulation allowed Union Pacific to expand its revenues at a brisk rate in the mid-2000s. In this graph, you can see that between 2007 and 2014, UNP was able to expand revenues from around $15 billion to just under $25 billion.
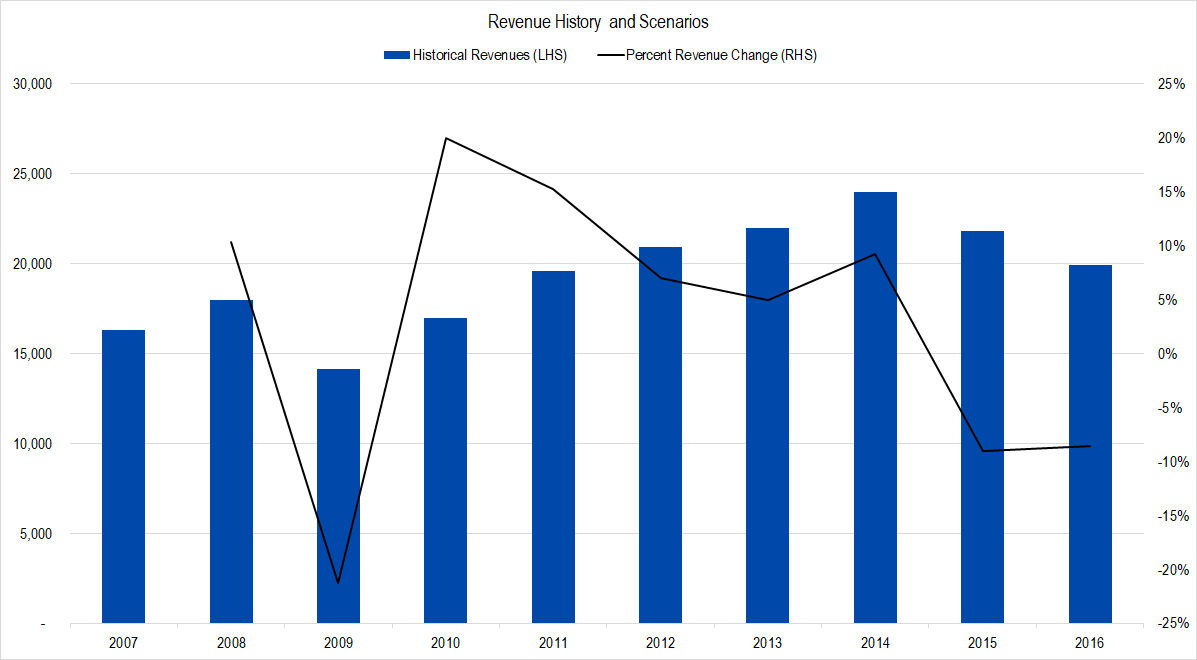
Figure 1. Source: Company Statements, Framework Investing Analysis
For our revenue forecasts, we looked at historical price and volume trends for all the freight type it transports.
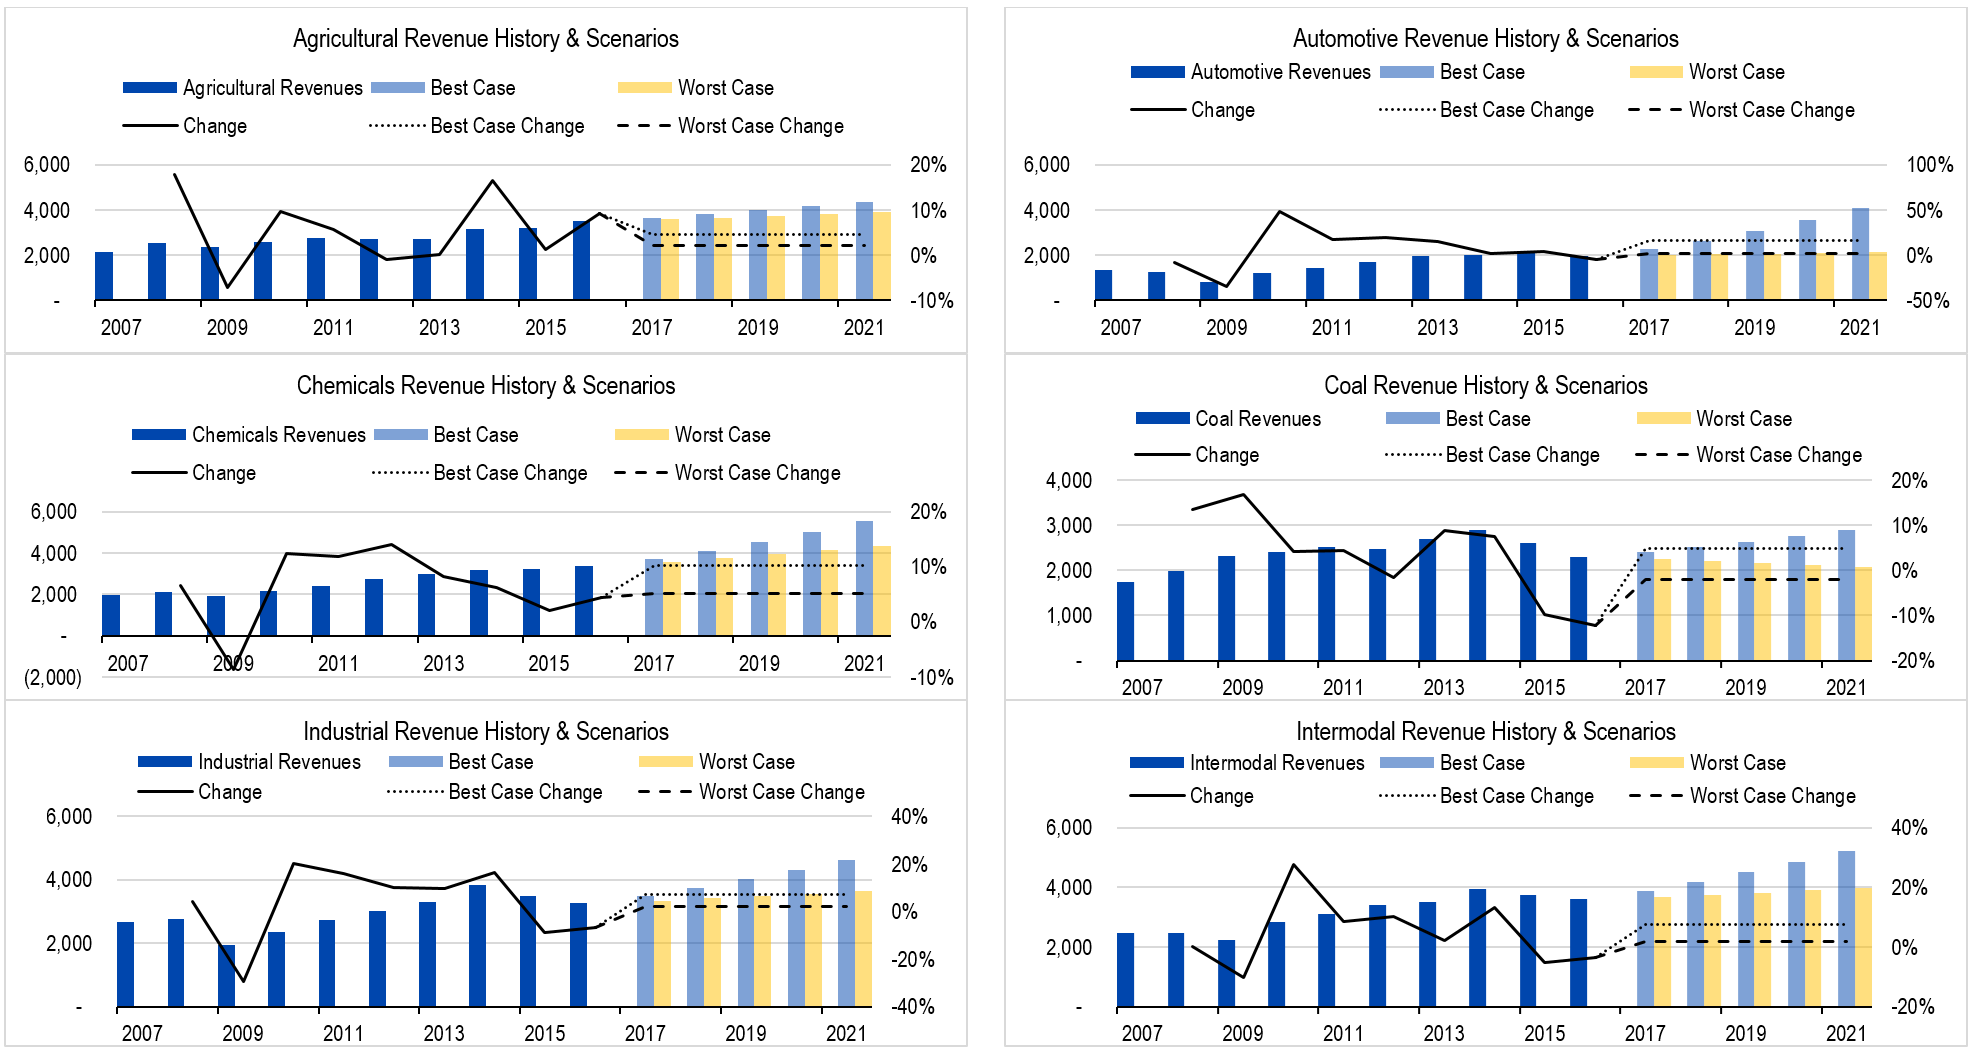
Figure 2. Source: Company Statements, Framework Investing Analysis
Our best-case revenue growth scenario – 9% on average for the next five years – assumes that the firm will able to retain the same pricing power and volume increases in the future as seen during the Rail Renaissance.
Our worst-case assumption of 3% growth per year are not as bullish, but certainly does not forecast a collapse in either volumes or pricing. These assumptions give us the following graph.
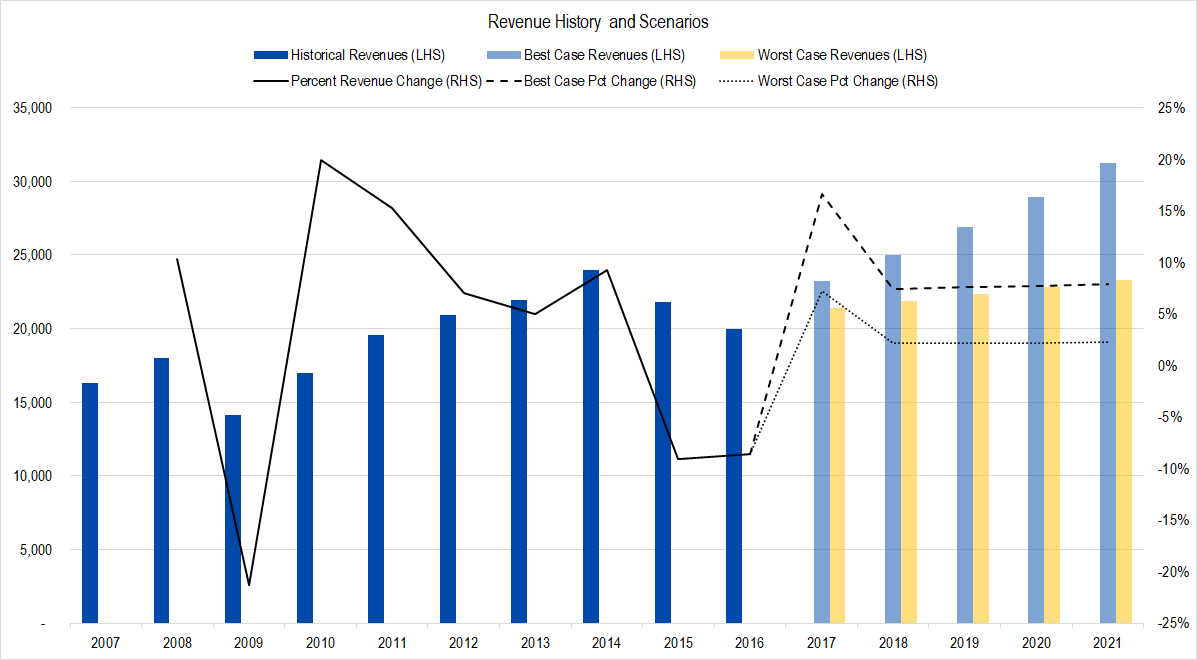
Figure 3. Source: Company Statements, Framework Investing Analysis
Profits
Our preferred metric is called Owners’ Cash Profits – OCP – which is based on the firm’s cash flows.
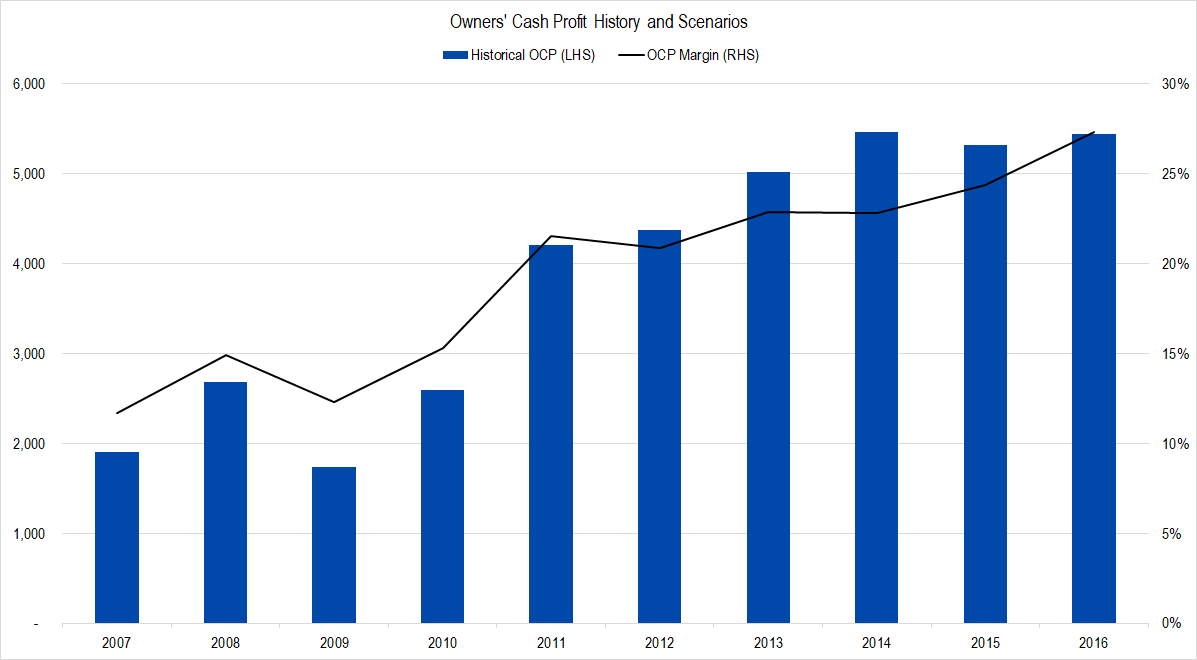
Figure 4. Source: Company Statements, Framework Investing Analysis
In addition to allowing for price rises, deregulation also gave railroads more freedom to divest, shorter, less profitable routes. The effect of this is very obvious in this chart, where normalized profit margins were in the mid-teens from 2007-2010, then suddenly shot up into the low- to mid- and now to the high-20% range.
There are signs that the very high recent profitability is unsustainable, but our best-case model assumes that the company will be able to generate average profits at the same rate at its historical maximum – 27% margins – over the next five years. Our worst-case assumption only assumes that profitability reverts to the mid-20% range.
Here is our profitability graph.
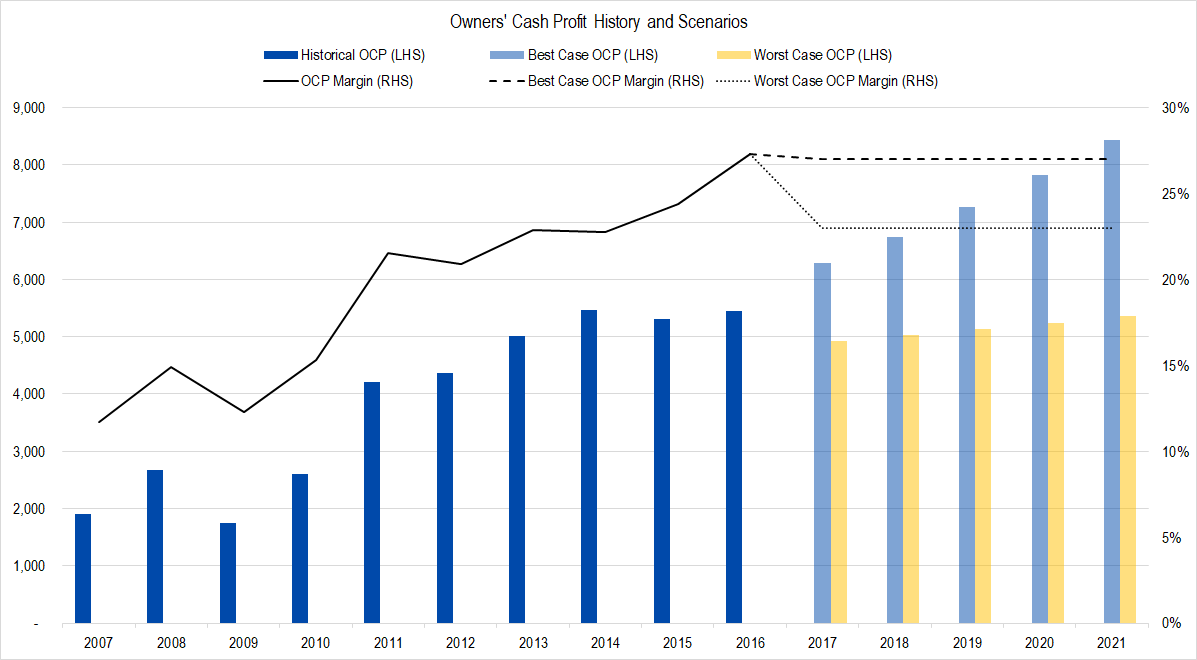
Figure 5. Source: Company Statements, Framework Investing Analysis
Investment Spending
In this graph, the wide gray columns represent Owners’ Cash Profits generated by the firm and the blue columns, the amount the company spent on investments. Over the past 10 years, Union Pacific has spent around 45% of its profits on investment spending, or “Expansionary Cash Flow” as we call it, and we think the business will require roughly this same level of investment over the next five years as well.
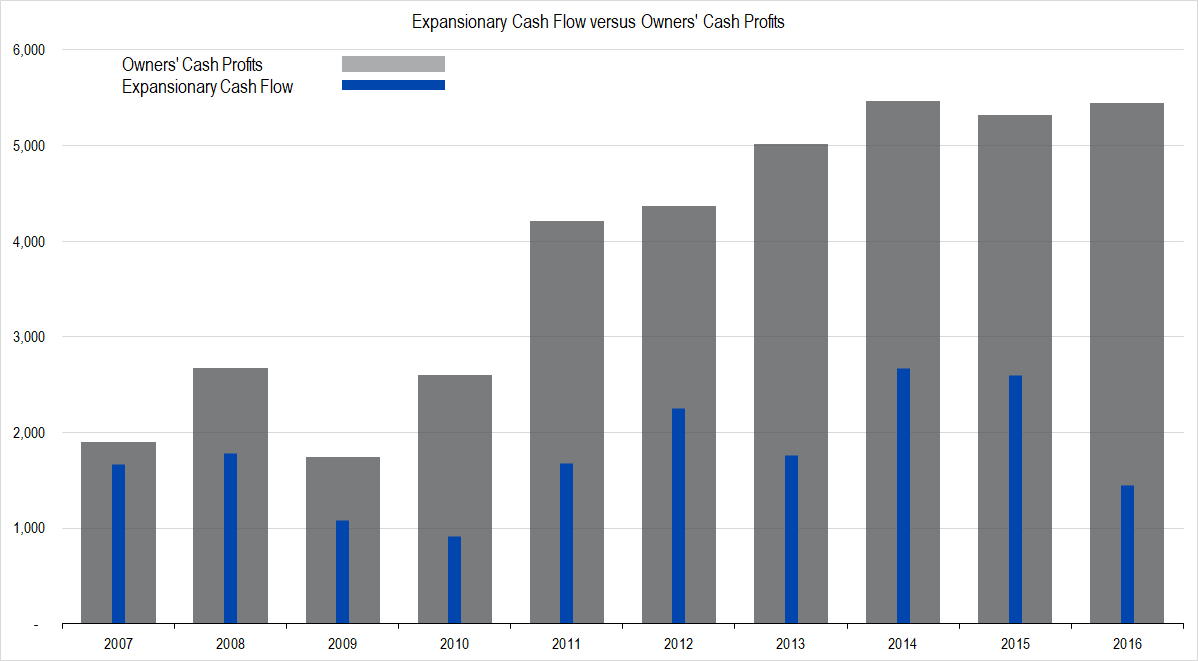
Figure 6. Source: Company Statements, Framework Investing Analysis
With this assumed investment level, we figure Union Pacific will be generating between $0.13 and $0.15 of Free Cash Flow to Owners (FCFO) for every dollar in revenues generated over the next five years.

Figure 7. Source: Company Statements, Framework Investing Analysis
Medium-Term Growth
Union Pacific has grown its cash flows very quickly for a very long time. Our stress-tested model assumes that the firm will be able to keep medium-term cash flow growing at a rate of of 7% per year in the best case and 5% per year in the worst.
Over a long time horizon, this implies UNP will generate cash flow growth that is much, much stronger than the economy at large.
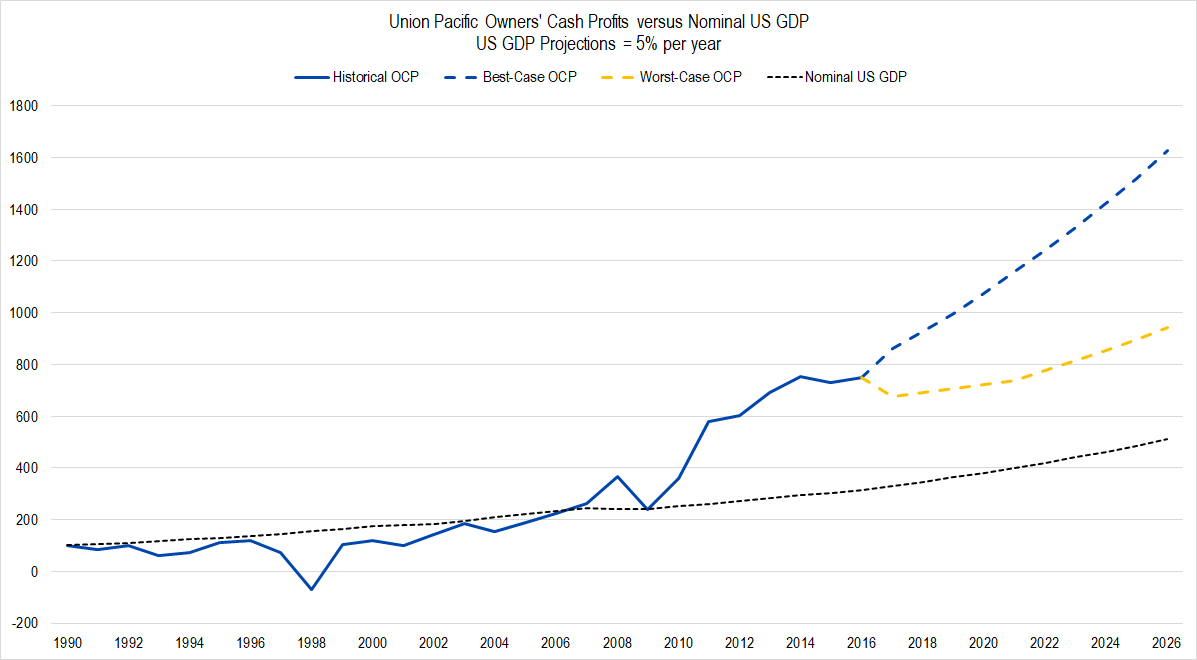
Figure 8. Source: Company Statements, Framework Investing Analysis
Valuation
Pulling this all together gives us a best-case valuation of $103 and a worst-case valuation of $63 per share with an equal weighting of all our eight valuation scenarios at $83 per share.
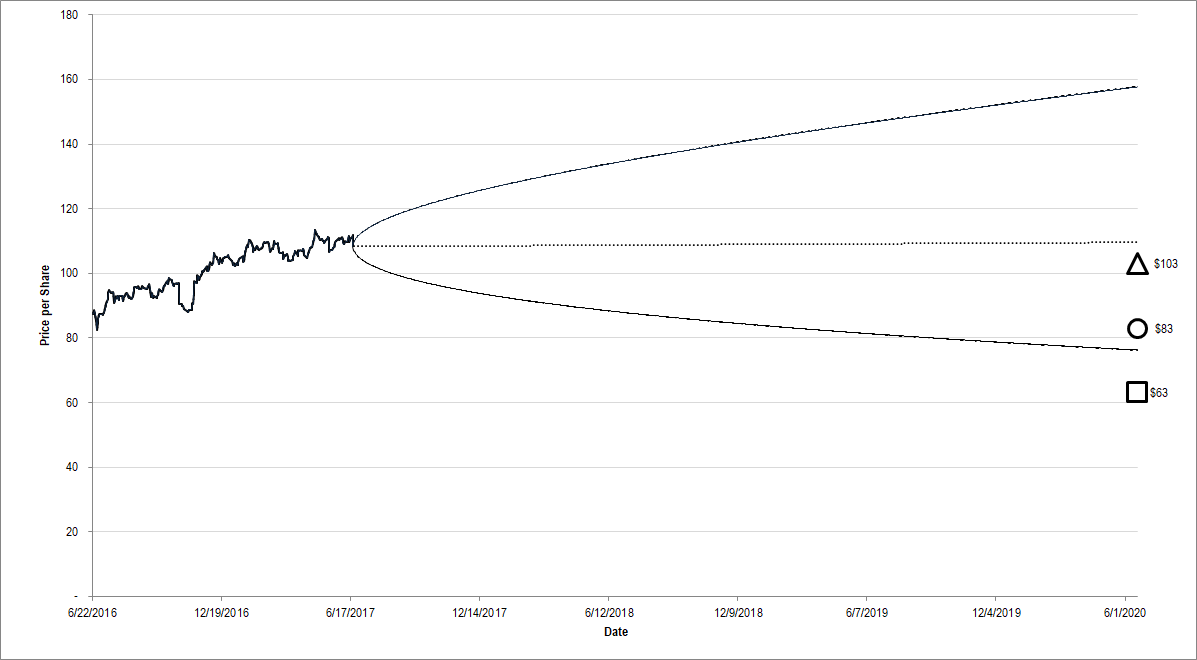
Figure 9. Source: YCharts, CBOE, Framework Investing Analysis
From this chart, it is obvious that our valuation range is considerably lower than the range of future prices implied by the option market. When these data were taken, the option market’s best-case price projection for three years out was nearly 60% higher than present prices, and the worst-case price projection sits just moderately lower than our median valuation case!
Keep in mind too that we believe the fair value range shown here is too high, as the scenarios represent a stress-test of our April 2016 model. Our earlier model was much more realistic in terms of operational performance and had a lower valuation range. Union Pacific’s 2017 actual results have tracked much closer to our 2016 forecasts than to these stress tested ones.