
This overview accompanies the IOI Valuation of Cisco Systems (CSCO) and is split into the following sections:
- Revenue Scenarios
- Economic Profit Scenarios
- Investment Efficacy Scenarios
IOI?s explicit forecast period for Cisco lasts five years.
Revenue Scenarios
I am familiar with Cisco from past work that I had done on the company, and remember well when CEO John Chambers announced that Cisco’s long-term growth rate would be between 12% and 17% per year. Contrast this with his statement at the most recent quarterly earnings that Cisco revenue growth would be between 3% and 5% for the foreseeable future. While I suppose these two statements are not mutually exclusive, just on the basis of the “Law of Large Numbers” (the financial version, not the statistical one…) and considering the competitive environment, I am more likely to believe Chambers on the latter point rather than the former one.
From previous work I had done on Cisco, I know that the firm generates a material proportion of its revenues (the company says “around 20%” but I thought the number may be nearly 25% a few years ago–depending on what digit to which one is rounding 25% is “around 20%” I suppose). Considering that developing economies’ governments’ latest mantra is “austerity,” it is reasonable to assume that any government contracts Cisco might win for the next few years will likely be smaller and less profitable than the firm was used to in the glory days.
There is some evidence that Cisco’s position on its networking equipment home turf has slipped a bit as smaller, more nimble competitors introduce specialized equipment with better technology than Cisco offers, and larger competitors bidding large jobs in a way to undercut Cisco’s prices. I am not a specialist in this field, so do not have definite proof of this competitive dynamic, but there is enough anecdotal evidence to make me think there is something to it. If true, it would be no surprise if Cisco’s revenue growth slowed somewhat.
In addition, Cisco has, over the past few years, been attempting to subtly reinvent itself from being simply a networking equipment maker into being a major force in “the datacenter” (i.e., supplying companies with storage systems, servers, and the like for the datacenters that run their businesses). This move has meant that Cisco has been able to report very rapid year-over-year growth in its datacenter related businesses. Small businesses do grow quickly, and considering the fact that Cisco’s name does have considerable brand equity and trust in the IT world, it is no surprise that Cisco might be able to expand into this business successfully. However, no matter how successful Cisco has been, it is worth noting that the other main competitors in this space are Hewlett-Packard (HPQ), IBM (IBM), and Dell (DELL). Setting aside for a moment the fact that two of those companies have faced some business difficulties lately and may be, shall we say, “enthusiastic” competitors, just the names of the firms is enough to indicate that Cisco will have a hard time just walking in and taking control of the dominant market share position. This also suggests that Cisco’s growth in the datacenter will slow as time passes.
Cisco’s past revenue growth have been positively influenced by acquisitions (especially Scientific Atlanta in FY2007, that added nearly $3 billion in revenues) and negatively influenced through the tech bust of 2001. These factors complicate the issue of organic growth for Cisco, but, all things considered, it looks to me like the business has been able to expand its revenues at about 7-9% per year over a couple of boom-bust cycles with relatively slower growth recently. In contrast, over this same time period, nominal GDP has grown at around 4% per year.
Taking these factors into consideration, we use the following worst- and best-case scenarios for Cisco’s revenue growth:
- IOI’s best case revenue scenario generates an average year-over-year (YoY) nominal growth rate and 5-year compound annual growth rate (5Y CAGR) of around 7%.
- IOI’s worst case revenue scenario generates an average YoY nominal growth rate of 4% and a 5Y CAGR of 5%.
Graphically, our assumptions are represented like this:
 |
|
Historical and Projected Rates of Revenue Growth
Source: Company Statements, IOI Analysis
|
Economic Profit Scenarios
IOI’s estimate of economic profit deducts an estimate of maintenance capital expenditures from cash flows from operations.
Cisco is nothing if not profitable. The real issue is how much of that profit makes it through to owners–a factor we will discuss in the next section.
From FY2001 through FY2008, Cisco’s economic profitability was predictably on one side of 25% or the other. However, competitive and environmental factors in the post mortgage-crisis global economy have reset Cisco’s profits lower. Considering the competitive dynamics and economic backdrop now facing Cisco, it seems reasonable to think that this downward profit reset will be more or less permanent. Best-case, profitability in really good years would approach that 25% level, but 25% would be a limit, not an average. Worst-case, shrinking governmental budgets and increased competition in the datacenter may see Cisco’s normalized profit level falling even below the 20% level, in our opinion.
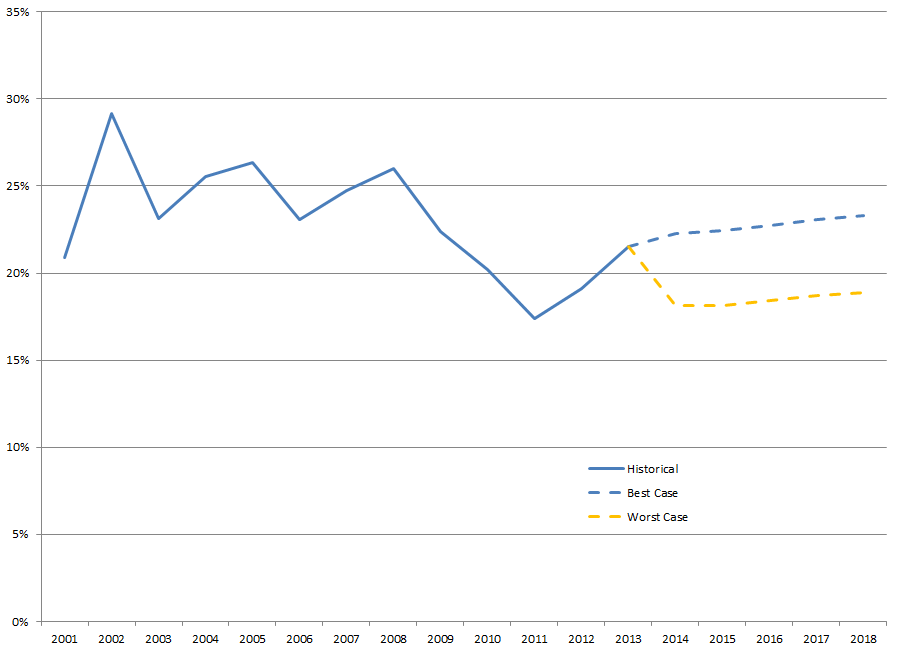 |
| IOI Estimates of Cisco’s Economic Profitability Source: Company Statements, IOI Analysis |
- IOI’s worst case profitability scenario generates an average economic profit margin of around 18% over the explicit forecast period.
- IOI’s best case profitability scenario generates an average economic profit margin of around 23% over the explicit forecast period.
Investing Efficacy Scenarios
Cisco outsources a great deal (perhaps all) of its manufacturing work to contractors and as such, requires very little capital investment. Most of what most people would consider growth investments are concentrated in acquisitions and joint ventures. However, a huge portion of what IOI counts as “investments” are moneys spent in purchasing its own stock in order to avoid earnings dilution.
I disagree with Warren Buffett that stock options issued to employees should be “expensed”–treated as an expense on a company’s Income Statement, in other words. The best tool to measure the price of options–the Black-Scholes model–does a poor job in some cases and the kinds of options issued to employees is one of those cases. Buffett is right that stock options and other forms of stock-based compensation do decrease the wealth of the shareholders, but I think there is a much easier way of quantifying the magnitude. That is by looking at how much the firm spends on buying back its own stock to avoid the mortal sin of EPS dilution.
The worst thing that any CEO can do from a career perspective is fail to grow earnings-per-share (EPS). There are a few ways of growing EPS that require innovation and hard work, and which actually increase the wealth of shareholders. Then there is the easy way: buying back shares.
It is now orthodox in the financial community (in other words, it is taught as axiomatic in all the best business schools) that a company’s buying back of shares “adds value” to the corporation’s owners as long as the shares are bought back at less than the company’s intrinsic value. CEOs have heard this tune and added their voices to it with great enthusiasm. They regularly announce proudly that the firm’s Board has approved a multi-billion dollar buyback program that will “return value” to shareholders.
The idea that buying undervalued shares is value creative is a well reasoned argument that might in fact be true in a perfect world.
Unfortunately, we do not live in a perfect world. In the real world, management teams reduce the cash pay to their employees and induce them to keep working by offering them an equity stake in the firm. Shareholders are impressed and happy that the “pro forma” expenses are so low (i.e., the expenses that do not consider non-cash stock compensation) and don’t seem to notice that the “value creative” stock buyback plans are actually mostly used to soak up the shares issued to the employees. Analysts who value companies using free cash flow usually miss this too because, indeed, stock-based compensation is a non-cash charge, so falls out of the FCF calculations.
I believe that here in the real world stock-based compensation is a reduction of the wealth that can accrue to shareholders. Usually, this wealth reduction comes in the forms of these anti-dilutionary buy backs, but of course it can come from dilution of the owners’ shares if management does not buy back shares (usually the case in smaller, newer companies).
Cisco is a poster boy for this type of not-quite-underhanded accounting gimmick, and spends an enormous amount of shareholder wealth in buying back shares. Proportionally, in fact, this is the largest investment that Cisco makes (compared to acquisitions and JVs). Since we are treating these back-door payments to employees as an investment on the part of management, a sensible question is what economic profit is each Cisco employee generating; this way, we can get a sense of how great a return the expenditure is generating. As a graph, our estimate of economic profitability per employee looks like this:
 |
| Estimated Economic Profit per Cisco Employee Source: Company statements, IOI Analysis |
While the trend is positive, it is only slightly so, and only thanks to the most recent fiscal year’s rebound. Looking at this, it is tough for us to say that Cisco’s investments in its employees are generating a great deal of wealth for its shareholders.
Looking at Cisco’s history of marginal real economic profit growth (i.e., economic profit growth at a rate faster than GDP overall), we get the following graph:
 |
| IOI Estimate of Cisco’s Marginal Growth in Real Economic Profits Source: Company Statements, IOI Analysis |
To me, this graph tells the same story as the one above. The recent trend is up, but it is hard to say that Cisco is reliably growing its shareholders’ economic profits at a rate greater than nominal GDP.
Taking these factors into consideration and also realizing that we are very much in the “New Normal” camp regarding economic growth, we come to the following:
- IOI’s worst case medium-term (forecast years 6-10) growth scenario implies a growth in nominal free cash flows of 5% per year.
- IOI’s best case medium-term growth scenario implies marginal nominal free cash flows of 7% per year.